Technical Analysis of SF 2024-05-31
Overview:
In analyzing the technical indicators for the stock SF over the last 5 days, we will delve into the trends, momentum, volatility, and volume indicators to provide a comprehensive outlook on the possible stock price movement in the coming days. By examining these key aspects, we aim to offer valuable insights and predictions to guide your investment decisions.
Trend Indicators:
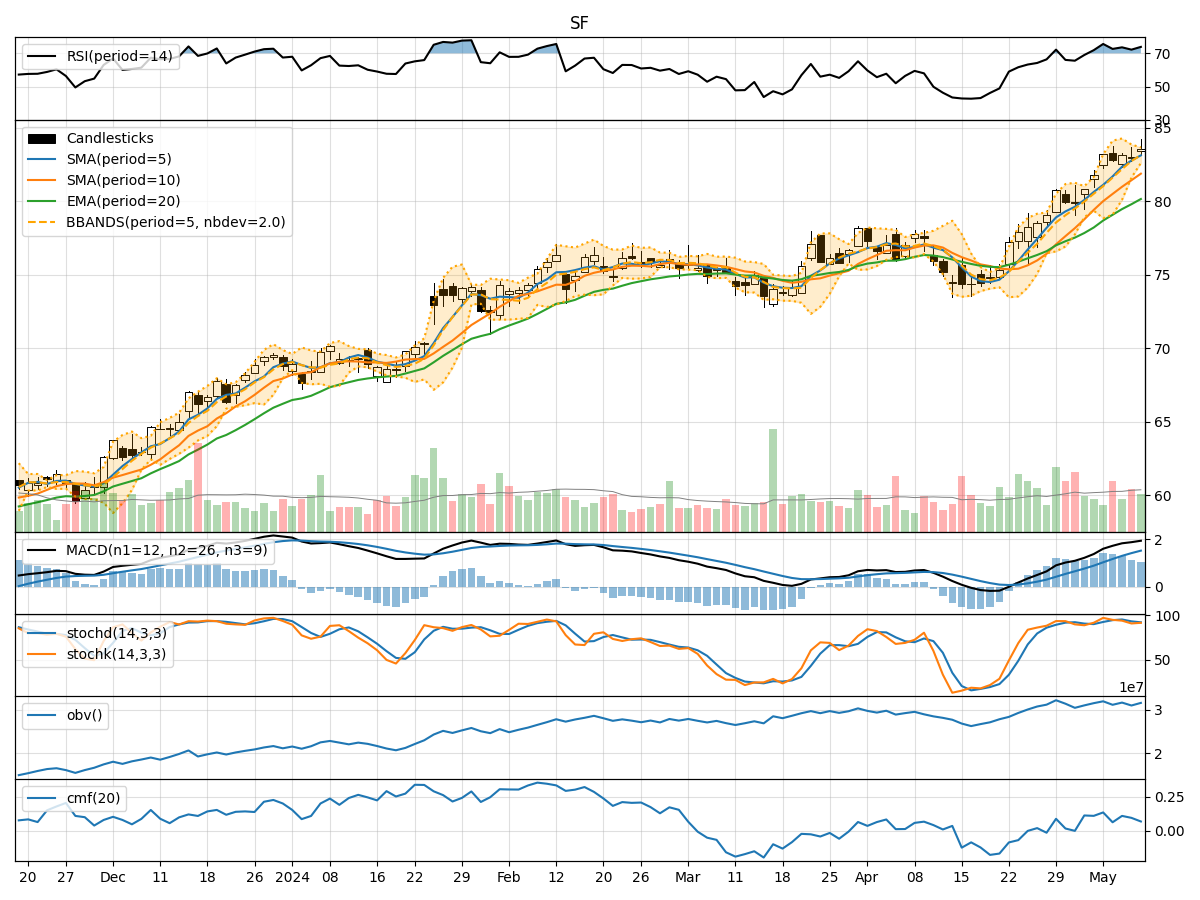
- Moving Averages (MA): The 5-day MA has been consistently below the closing prices, indicating a short-term downtrend.
- MACD: The MACD line has been decreasing, with the MACD histogram also showing a downward trend, suggesting a bearish momentum.
- EMA: The EMA has been declining, further supporting the bearish sentiment in the short to medium term.
Momentum Indicators:
- RSI: The RSI has been fluctuating around the 50 level, indicating a lack of strong momentum in either direction.
- Stochastic Oscillator: Both %K and %D have been relatively low, signaling a potential oversold condition.
- Williams %R: The Williams %R has been in the oversold territory, suggesting a possible reversal or consolidation.
Volatility Indicators:
- Bollinger Bands (BB): The stock price has been trading within the lower Bollinger Band, indicating a period of low volatility.
- BB Width: The Bollinger Band width has been narrowing, suggesting a potential breakout or significant price movement ahead.
Volume Indicators:
- On-Balance Volume (OBV): The OBV has been declining, indicating selling pressure and potential bearish sentiment.
- Chaikin Money Flow (CMF): The CMF has been negative, reflecting a lack of buying interest and potential weakness in the stock.
Key Observations and Opinions:
- Trend: The stock is currently in a short-term downtrend, supported by the moving averages and MACD indicators.
- Momentum: The momentum indicators suggest a lack of strong directional momentum, with potential for a reversal or consolidation.
- Volatility: The narrowing Bollinger Bands and low volatility indicate a period of consolidation or potential breakout.
- Volume: The declining OBV and negative CMF point towards selling pressure and bearish sentiment in the stock.
Conclusion:
Based on the analysis of the technical indicators, the stock SF is likely to experience further downside movement in the coming days. The overall trend, momentum, and volume indicators all point towards a bearish outlook. Traders and investors should exercise caution and consider shorting or staying on the sidelines until a clear reversal pattern emerges. The low volatility and potential oversold conditions may lead to a brief consolidation before any significant price movement.