Technical Analysis of SHEL 2024-05-10
Overview:
In analyzing the technical indicators for SHEL stock over the last 5 days, we will delve into the trend, momentum, volatility, and volume indicators to provide a comprehensive outlook on the possible stock price movement in the coming days. By examining key metrics such as moving averages, MACD, RSI, Bollinger Bands, and OBV, we aim to offer valuable insights and predictions for potential investors.
Trend Indicators:
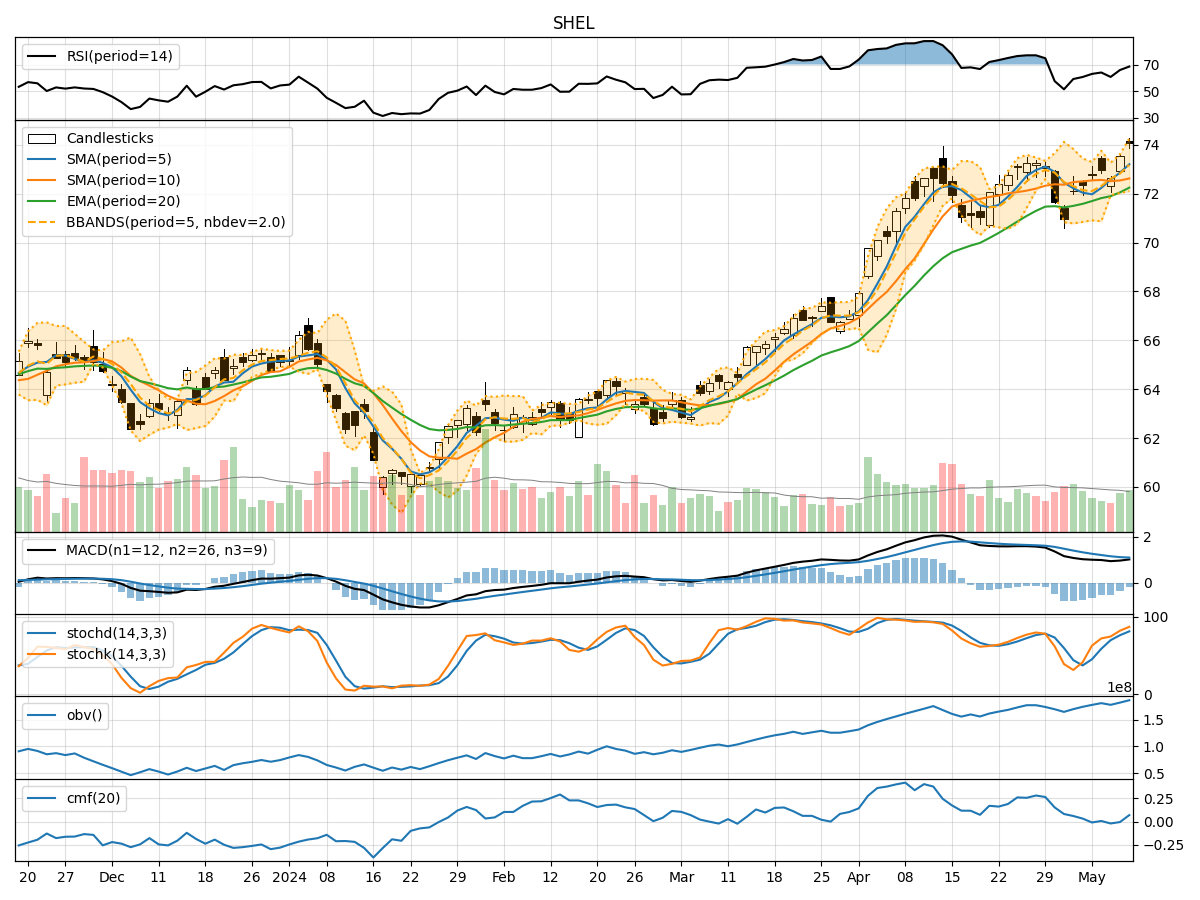
- Moving Averages (MA): The 5-day moving average has been showing an upward trend, indicating a positive momentum in the stock price.
- MACD: The MACD line has been consistently above the signal line, suggesting a bullish trend in the stock.
- EMA: The exponential moving average has been steadily increasing, supporting the bullish sentiment in the stock.
Momentum Indicators:
- RSI: The Relative Strength Index has been trending upwards, reaching levels above 50, indicating increasing buying pressure.
- Stochastic Oscillator: Both %K and %D lines of the Stochastic Oscillator have been in the overbought zone, signaling a strong bullish momentum.
- Williams %R: The Williams %R is in the oversold territory, suggesting a potential reversal in the stock price.
Volatility Indicators:
- Bollinger Bands: The stock price has been trading within the upper Bollinger Band, indicating a period of high volatility and potential overbought conditions.
- Bollinger Band Width: The Band Width has been expanding, suggesting increased price volatility in the stock.
Volume Indicators:
- On-Balance Volume (OBV): The OBV indicator has been trending upwards, indicating that volume has been higher on days with upward price movement.
- Chaikin Money Flow (CMF): The CMF has been fluctuating around the zero line, indicating a balance between buying and selling pressure.
Key Observations and Opinions:
- Trend: The stock is currently in an upward trend based on moving averages and MACD.
- Momentum: Momentum indicators suggest a strong bullish sentiment with overbought conditions.
- Volatility: The stock is experiencing high volatility as indicated by the Bollinger Bands.
- Volume: Increasing OBV and fluctuating CMF indicate positive buying interest in the stock.
Conclusion:
Based on the analysis of the technical indicators, the next few days for SHEL stock are likely to see a continuation of the bullish trend. The stock price may experience further upward movement supported by strong momentum and buying interest. Investors could consider buying opportunities in anticipation of potential price appreciation. However, it is essential to monitor the indicators closely for any signs of reversal or overbought conditions.