Technical Analysis of TDY 2024-05-10
Overview:
In analyzing the technical indicators for TDY over the last 5 days, we will delve into the trend, momentum, volatility, and volume indicators to provide a comprehensive outlook on the possible stock price movement in the coming days. By examining these key aspects, we aim to offer valuable insights and predictions to guide your investment decisions.
Trend Analysis:
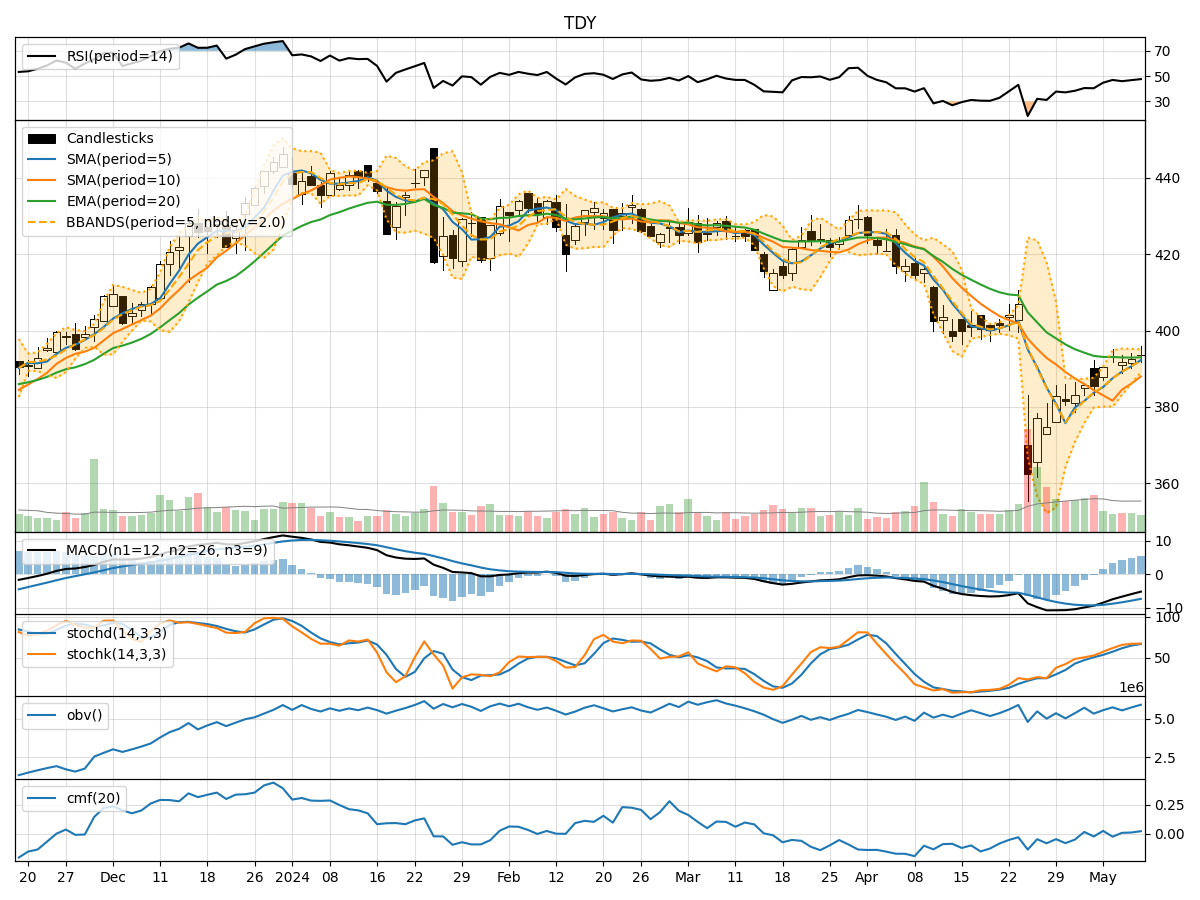
- Moving Averages (MA): The 5-day Moving Average (MA) has been consistently above the Simple Moving Average (SMA) and Exponential Moving Average (EMA) over the past 5 days, indicating a bullish trend.
- MACD: The Moving Average Convergence Divergence (MACD) has shown positive values, with the MACD line consistently above the Signal line, suggesting bullish momentum in the stock price.
Momentum Analysis:
- RSI: The Relative Strength Index (RSI) has been gradually increasing and is currently in the neutral zone, indicating potential room for further price movement in either direction.
- Stochastic Oscillator: Both %K and %D lines of the Stochastic Oscillator are in the overbought territory, suggesting a potential reversal or consolidation in the stock price.
Volatility Analysis:
- Bollinger Bands (BB): The Bollinger Bands have shown a narrowing of the bands, indicating decreasing volatility and a possible period of consolidation in the stock price.
Volume Analysis:
- On-Balance Volume (OBV): The OBV has shown mixed signals with fluctuations in volume, indicating indecision among market participants.
- Chaikin Money Flow (CMF): The CMF has been positive over the past 5 days, suggesting buying pressure in the stock.
Key Observations:
- The trend indicators suggest a bullish sentiment in the stock price, supported by the positive MACD values.
- Momentum indicators show a potential overbought condition, signaling a need for caution regarding further upside potential.
- Volatility indicators point towards a period of consolidation, with decreasing price fluctuations.
- Volume indicators reflect mixed signals, indicating uncertainty among investors regarding the stock's future direction.
Conclusion:
Based on the analysis of the technical indicators, the stock price of TDY is likely to experience a period of consolidation in the coming days. The bullish trend supported by the MA and MACD indicators may face resistance due to the overbought condition highlighted by the Stochastic Oscillator. The narrowing Bollinger Bands suggest reduced volatility and a potential sideways movement in the stock price. The mixed signals from the volume indicators further reinforce the expectation of a consolidation phase.
Recommendation:
Considering the current market dynamics and technical indicators, it is advisable to exercise caution and closely monitor the stock price of TDY in the upcoming days. Traders may consider implementing range-bound strategies to capitalize on potential price fluctuations within the consolidation phase. Long-term investors should wait for clearer signals or a breakout from the consolidation pattern before making significant investment decisions.
By staying informed and adapting to changing market conditions, investors can navigate uncertainties and make well-informed decisions to optimize their investment outcomes.