Technical Analysis of TIXT 2024-05-31
Overview:
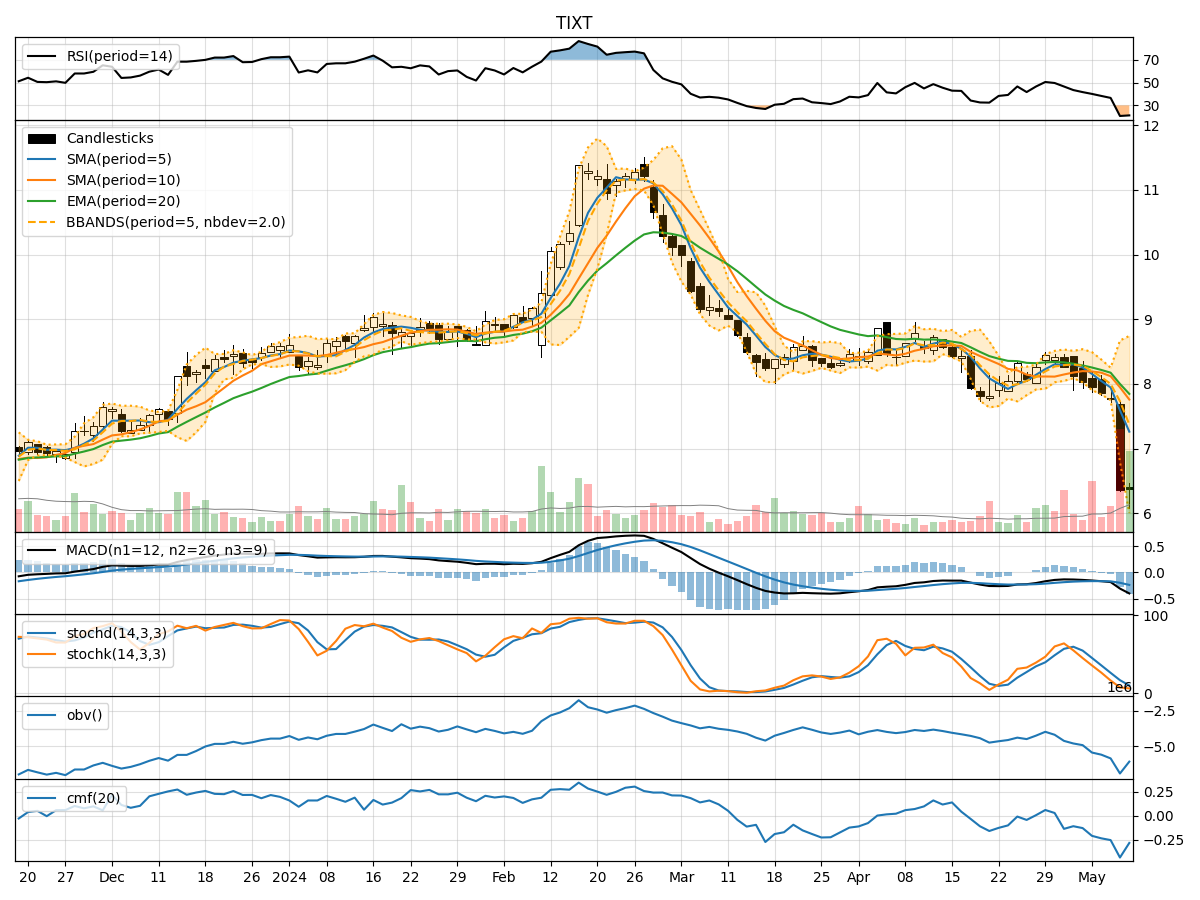
In analyzing the technical indicators for TIXT over the last 5 days, we will delve into the trend, momentum, volatility, and volume indicators to provide a comprehensive outlook on the possible stock price movement in the coming days. By examining these key indicators, we aim to offer valuable insights and predictions to guide investment decisions.
Trend Analysis:
- Moving Averages (MA): The 5-day MA has been consistently below the closing price, indicating a downward trend.
- MACD: The MACD line has been below the signal line, suggesting bearish momentum.
- EMA: The EMA has been declining, further confirming the bearish trend.
Momentum Analysis:
- RSI: The RSI has been relatively low, indicating oversold conditions.
- Stochastic Oscillator: Both %K and %D have been in the oversold territory, signaling a potential reversal.
- Williams %R: The indicator has been in the oversold region, suggesting a possible upward movement.
Volatility Analysis:
- Bollinger Bands (BB): The stock price has been trading below the lower Bollinger Band, indicating oversold conditions.
- Bollinger Band Width: The band width has widened, suggesting increased volatility.
- Bollinger Band %B: The %B indicator is below 0.2, indicating potential oversold conditions.
Volume Analysis:
- On-Balance Volume (OBV): The OBV has been declining, reflecting selling pressure.
- Chaikin Money Flow (CMF): The CMF has been negative, indicating outflow of money from the stock.
Key Observations:
- The stock is currently in a downtrend based on moving averages and MACD.
- Momentum indicators suggest a possible reversal due to oversold conditions.
- Volatility indicators point towards increased volatility and potential oversold conditions.
- Volume indicators reflect selling pressure and negative money flow.
Conclusion:
Based on the analysis of technical indicators, the next few days for TIXT are likely to see a potential reversal in the stock price. The oversold conditions indicated by momentum indicators, coupled with the widening Bollinger Bands and negative OBV, suggest a possible upward movement in the stock price. However, investors should closely monitor the price action and key support/resistance levels for confirmation of the reversal.