Technical Analysis of TNL 2024-05-31
Overview:
In analyzing the technical indicators for TNL over the last 5 days, we will delve into the trend, momentum, volatility, and volume indicators to provide a comprehensive outlook on the possible stock price movement in the coming days. By examining these key aspects, we aim to offer valuable insights and predictions to guide your investment decisions.
Trend Analysis:
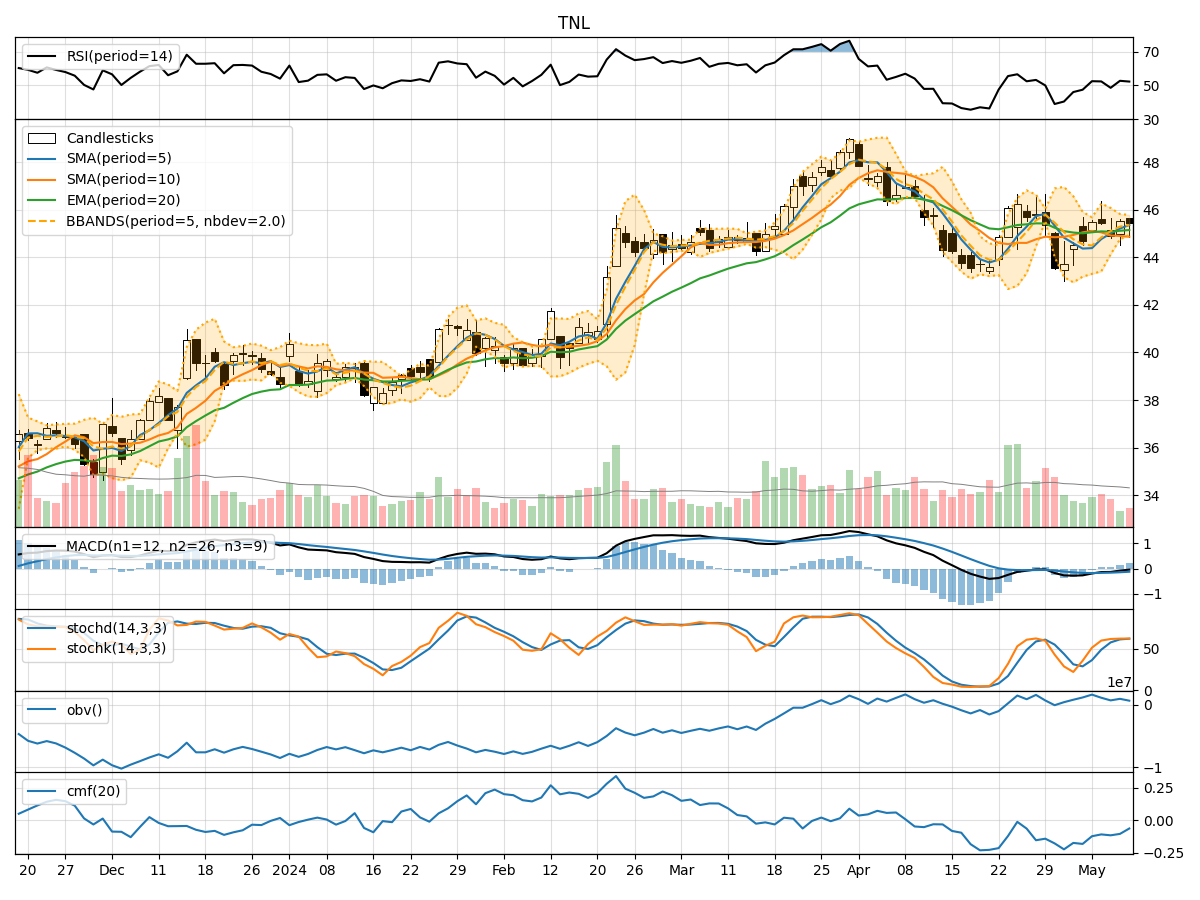
- Moving Averages (MA): The 5-day MA has been consistently below the closing prices, indicating a short-term downtrend.
- MACD: The MACD line has been below the signal line, suggesting a bearish momentum.
- EMA: The EMA has been trending downwards, reflecting a weakening trend.
Key Observation: The trend indicators point towards a bearish sentiment in the stock's price movement.
Momentum Analysis:
- RSI: The RSI has been decreasing, indicating a loss in bullish momentum.
- Stochastic Oscillator: Both %K and %D have been declining, signaling a potential reversal in momentum.
- Williams %R: The indicator has been in oversold territory, suggesting a possible bounce back.
Key Observation: Momentum indicators are currently bearish but showing signs of potential reversal.
Volatility Analysis:
- Bollinger Bands (BB): The stock price has been trading within the lower Bollinger Band, indicating a period of low volatility.
- Bollinger %B: The %B is below 1, suggesting the stock is trading below the lower band.
Key Observation: Volatility indicators imply a sideways movement with a potential for a breakout.
Volume Analysis:
- On-Balance Volume (OBV): The OBV has been fluctuating, indicating indecision among investors.
- Chaikin Money Flow (CMF): The CMF has been negative, reflecting selling pressure.
Key Observation: Volume indicators suggest a neutral stance with no clear direction.
Conclusion:
Based on the analysis of the technical indicators, the overall outlook for TNL in the next few days leans towards a bearish trend with a potential for a reversal in momentum. The stock is likely to experience sideways movement with low volatility, indicating a period of consolidation before a possible breakout. Investors should closely monitor key levels and wait for confirmation of a new trend before making any significant trading decisions.
Key Takeaways:
- Trend: Bearish
- Momentum: Bearish with signs of potential reversal
- Volatility: Sideways with potential for breakout
- Volume: Neutral
It is crucial to remain vigilant and adapt to changing market conditions to capitalize on potential opportunities while managing risks effectively.