Technical Analysis of TRGP 2024-05-31
Overview:
In analyzing the technical indicators for TRGP over the last 5 days, we will delve into the trend, momentum, volatility, and volume indicators to provide a comprehensive outlook on the possible stock price movement in the coming days.
Trend Analysis:
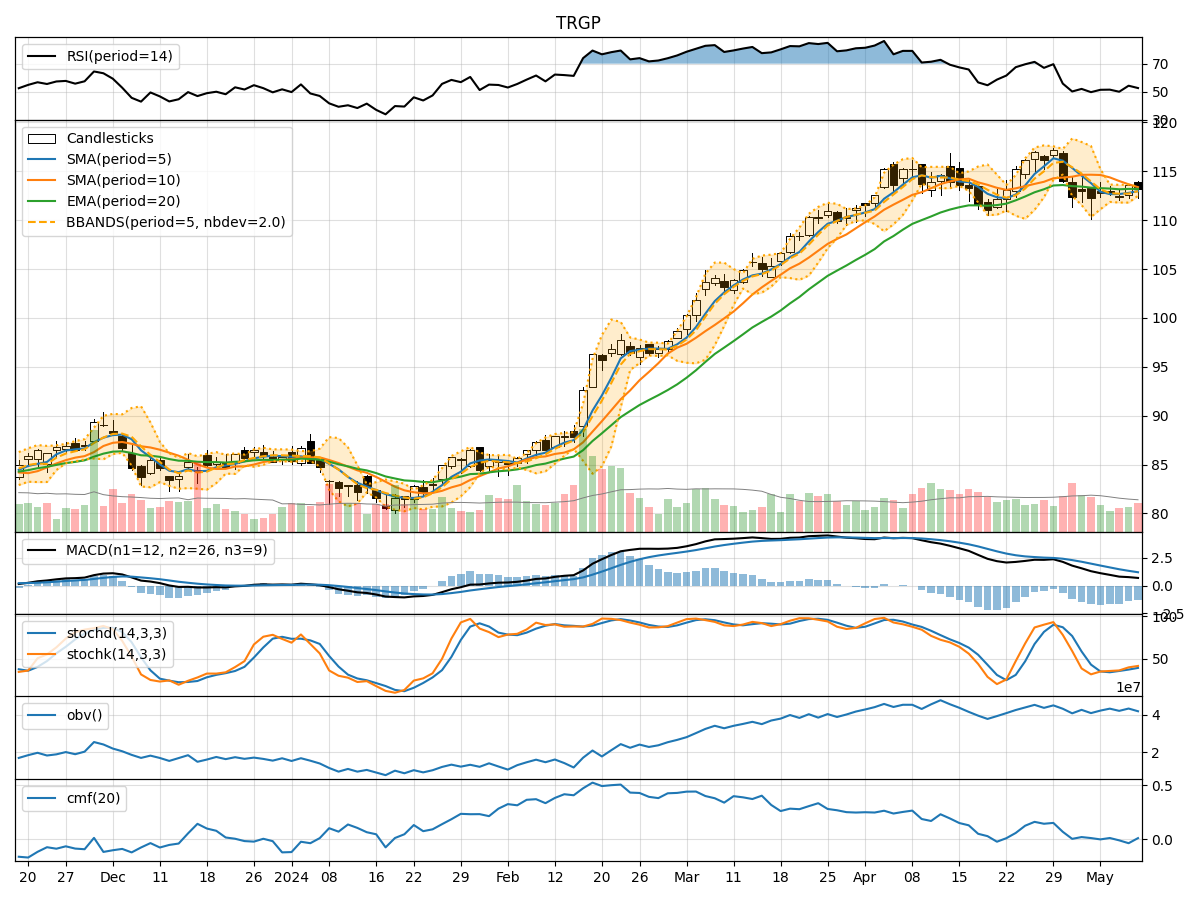
- Moving Averages (MA): The 5-day Moving Average (MA) has been fluctuating around the closing prices, indicating short-term price trends. The Simple Moving Average (SMA) and Exponential Moving Average (EMA) have shown slight variations but have not diverged significantly.
- MACD: The Moving Average Convergence Divergence (MACD) has been positive, suggesting bullish momentum in the stock price. The MACD Histogram has been fluctuating around the zero line, indicating potential shifts in momentum.
Momentum Analysis:
- RSI: The Relative Strength Index (RSI) has been hovering around the mid-level, indicating a balanced momentum between buying and selling pressure.
- Stochastic Oscillator: Both %K and %D lines of the Stochastic Oscillator have been moving upwards, suggesting increasing buying pressure. The Williams %R indicator has been in the oversold territory, indicating a potential reversal.
Volatility Analysis:
- Bollinger Bands: The Bollinger Bands have been narrowing, indicating decreasing volatility in the stock price. The bands have not shown significant expansion or contraction, suggesting a stable price range.
- Bollinger %B: The %B indicator has been fluctuating around the mid-level, indicating a balanced price movement within the bands.
Volume Analysis:
- On-Balance Volume (OBV): The OBV indicator has shown a slight increase, suggesting a positive accumulation of volume in the stock.
- Chaikin Money Flow (CMF): The CMF has been negative but trending upwards, indicating a potential influx of money into the stock.
Conclusion:
Based on the analysis of the technical indicators, the stock price of TRGP is likely to experience sideways movement in the coming days. The trend indicators show a neutral stance with no clear trend direction. Momentum indicators suggest a balanced momentum between buyers and sellers. Volatility indicators point towards stability in price movements, while volume indicators indicate moderate accumulation.
Considering the overall picture, it is recommended to exercise caution and closely monitor the price action for any potential breakout or breakdown. No strong bullish or bearish bias is evident based on the current technical analysis. Traders may consider adopting a wait-and-see approach until clearer signals emerge in the market dynamics.
Always remember to conduct further research and consider fundamental factors before making any investment decisions.