Technical Analysis of TS 2024-05-31
Overview:
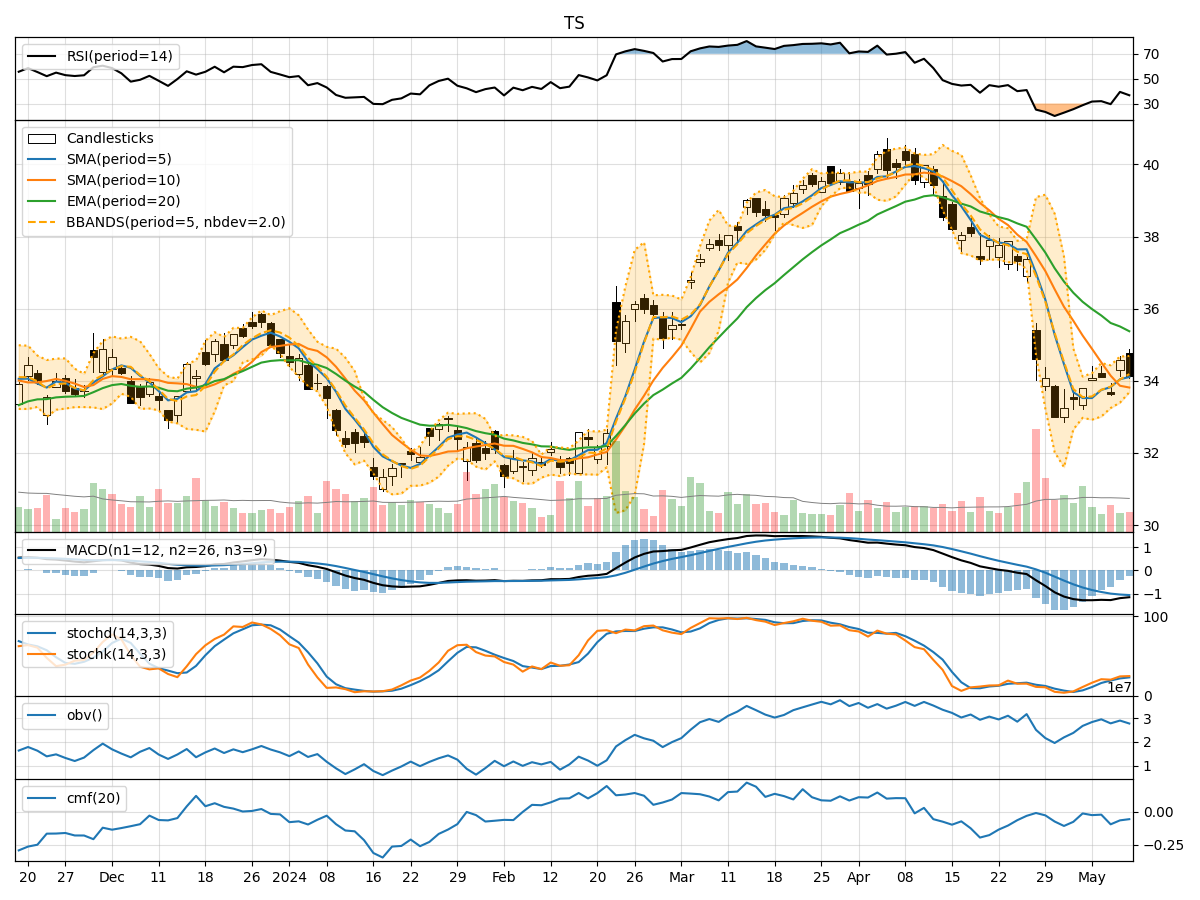
In the last 5 trading days, the stock price has shown some volatility with fluctuations in both price and volume. The trend indicators suggest a slight bearish sentiment, while momentum indicators indicate a weakening trend. Volatility indicators show fluctuating price bands, and volume indicators suggest a decrease in buying pressure.
Trend Analysis:
- Moving averages (MA) indicate a downward trend, with the 5-day MA consistently below the 10-day simple moving average (SMA).
- Exponential moving average (EMA) also shows a downward trend, with the stock price below the EMA.
- MACD and MACD Histogram are negative, indicating a bearish momentum.
Momentum Analysis:
- Relative Strength Index (RSI) is below 50, indicating a weakening momentum.
- Stochastic oscillators show a downward trend, with both %K and %D below 50.
- Williams %R is in oversold territory, suggesting a potential reversal.
Volatility Analysis:
- Bollinger Bands show narrowing bands, indicating decreasing volatility.
- The %B indicator is below 1, suggesting the price is below the lower Bollinger Band.
Volume Analysis:
- On-Balance Volume (OBV) has been decreasing, indicating selling pressure.
- Chaikin Money Flow (CMF) is negative, indicating a lack of buying interest.
Key Observations:
- The stock is currently in a downtrend based on moving averages and MACD.
- Momentum indicators suggest a weakening trend, with potential for a reversal indicated by Williams %R.
- Volatility is decreasing, which could lead to a period of consolidation.
- Volume indicators show a decrease in buying pressure, aligning with the bearish sentiment.
Conclusion:
Based on the technical analysis of trend, momentum, volatility, and volume indicators, the stock is likely to continue its downward movement in the short term. Traders should exercise caution as the stock shows signs of weakness and lack of buying interest. A potential reversal might occur if the price reaches oversold levels, as indicated by Williams %R. However, until there is a clear shift in momentum and volume, the overall outlook remains bearish. It is advisable to wait for confirmation of a trend reversal before considering any long positions.