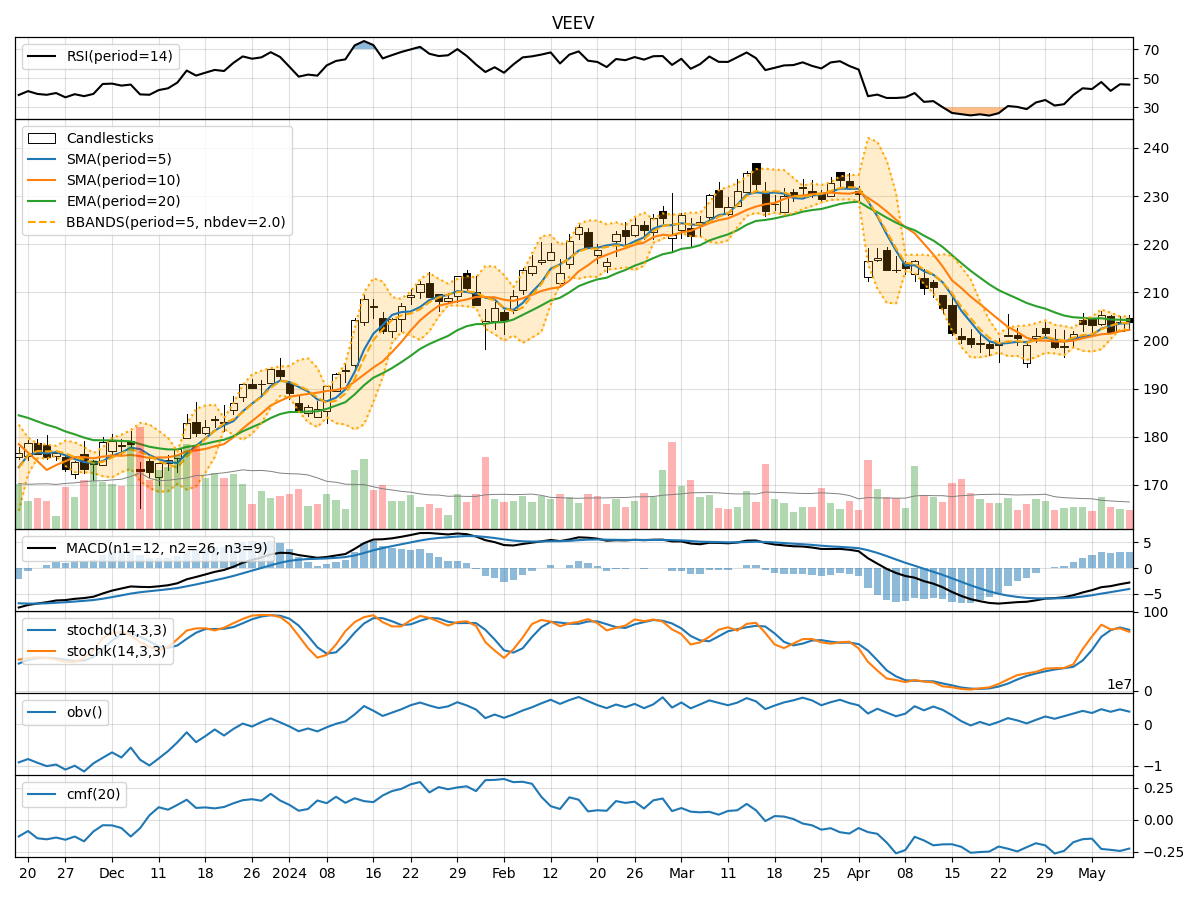
Technical Analysis of VEEV 2024-05-31
Overview:
In analyzing the technical indicators for VEEV over the last 5 days, we will delve into the trend, momentum, volatility, and volume indicators to provide a comprehensive outlook on the possible stock price movement in the coming days. By examining these key aspects, we aim to offer valuable insights and predictions for potential investors.
Trend Analysis:
- Moving Averages (MA): The 5-day MA has been consistently below the SMA(10) and EMA(20), indicating a downward trend in the stock price.
- MACD: The MACD line has been decreasing, with the MACD line crossing below the signal line, suggesting a bearish momentum.
- MACD Histogram: The MACD histogram has been negative, indicating a strengthening bearish momentum.
Momentum Analysis:
- RSI: The RSI has been declining and is currently in the oversold territory, signaling a potential reversal or consolidation.
- Stochastic Oscillator: Both %K and %D have been decreasing, showing a bearish momentum.
- Williams %R: The indicator has been in the oversold region, indicating a potential reversal or consolidation.
Volatility Analysis:
- Bollinger Bands (BB): The stock price has breached the lower Bollinger Band, suggesting oversold conditions and a possible reversal or consolidation.
- Bollinger Band Width: The BB width has widened, indicating increased volatility in the stock price.
Volume Analysis:
- On-Balance Volume (OBV): The OBV has been consistently decreasing, reflecting selling pressure in the stock.
- Chaikin Money Flow (CMF): The CMF has been negative, indicating a bearish money flow in the stock.
Key Observations:
- The stock is currently in a downtrend based on moving averages and MACD analysis.
- Momentum indicators like RSI and Stochastic Oscillator suggest an oversold condition, potentially hinting at a reversal or consolidation.
- Volatility has increased as seen in the widening Bollinger Bands, indicating higher price fluctuations.
- The OBV and CMF reflect negative sentiment and selling pressure in the stock.
Conclusion:
Based on the technical analysis of trend, momentum, volatility, and volume indicators, the outlook for VEEV in the next few days is bearish. The stock is likely to experience further downward pressure, potentially leading to lower stock prices. Traders and investors should exercise caution and consider waiting for signs of a reversal or consolidation before considering any long positions.