Technical Analysis of VET 2024-05-31
Overview:
In analyzing the technical indicators for VET over the last 5 days, we will delve into the trend, momentum, volatility, and volume indicators to provide a comprehensive outlook on the possible stock price movement in the coming days. By examining these key aspects, we aim to offer valuable insights and predictions for potential investors.
Trend Analysis:
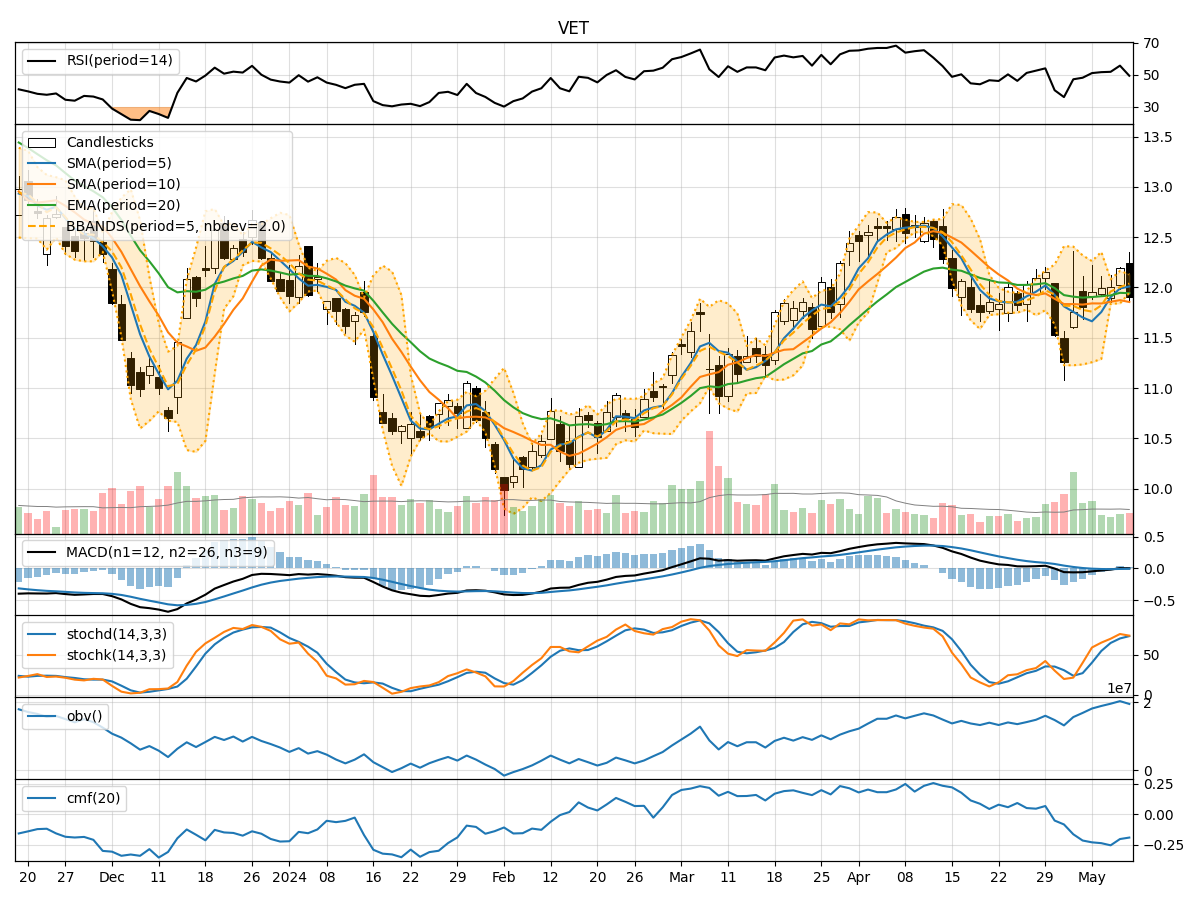
- Moving Averages (MA): The 5-day Moving Average (MA) has been fluctuating around the stock price, indicating short-term volatility. The Simple Moving Average (SMA) and Exponential Moving Average (EMA) show a slight upward trend, suggesting a potential bullish sentiment.
- MACD: The Moving Average Convergence Divergence (MACD) and its signal line have been positive, with the MACD histogram showing an increasing trend. This signals a bullish momentum in the stock.
Momentum Analysis:
- RSI: The Relative Strength Index (RSI) has been hovering around the neutral zone, indicating a balanced momentum between buying and selling pressure.
- Stochastic Oscillator: Both %K and %D lines of the Stochastic Oscillator have been moving upwards, suggesting a strengthening bullish momentum.
- Williams %R: The Williams %R indicator shows the stock is oversold, indicating a potential buying opportunity.
Volatility Analysis:
- Bollinger Bands: The Bollinger Bands have been narrowing, indicating decreasing volatility in the stock price. This could signal a period of consolidation or a potential breakout in the near future.
Volume Analysis:
- On-Balance Volume (OBV): The OBV indicator has been relatively stable, showing a neutral volume flow in the stock.
- Chaikin Money Flow (CMF): The CMF has been negative, indicating a slight outflow of money from the stock.
Key Observations:
- The trend indicators suggest a potential bullish sentiment in the stock, supported by the positive MACD and moving averages.
- Momentum indicators show a mixed signal, with RSI indicating neutrality, while Stochastic Oscillator and Williams %R suggest a bullish momentum.
- Volatility is decreasing based on Bollinger Bands, hinting at a possible period of consolidation.
- Volume indicators show a neutral volume flow, with a slight outflow of money based on CMF.
Conclusion:
Based on the analysis of the technical indicators, the next few days' possible stock price movement for VET appears to be upward. The bullish sentiment indicated by the trend indicators and the strengthening momentum from the Stochastic Oscillator align with the potential for a price increase. However, investors should closely monitor the volatility for any breakout opportunities and keep an eye on volume flow for confirmation of the bullish trend. Overall, the outlook for VET in the coming days leans towards a bullish trajectory.