Technical Analysis of WELL 2024-05-31
Overview:
In analyzing the technical indicators for WELL over the last 5 days, we will delve into the trend, momentum, volatility, and volume indicators to provide a comprehensive outlook on the possible stock price movement in the coming days.
Trend Analysis:
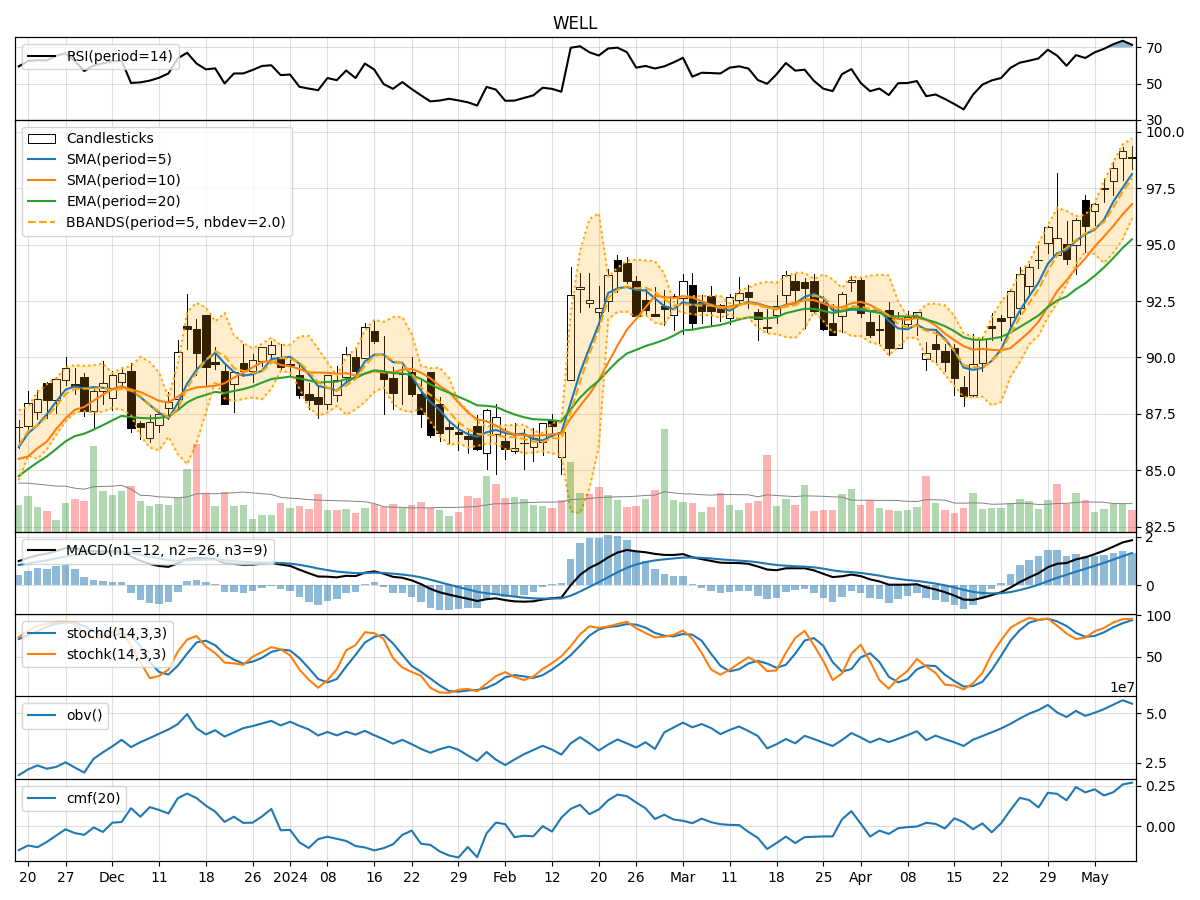
- Moving Averages (MA): The 5-day Moving Average (MA) has been fluctuating around the $100 mark, indicating a relatively stable price trend.
- MACD: The Moving Average Convergence Divergence (MACD) has shown mixed signals with slight fluctuations, suggesting indecision in the market.
- EMA: The Exponential Moving Average (EMA) has been gradually increasing, indicating a potential bullish sentiment in the mid to long term.
Momentum Analysis:
- RSI: The Relative Strength Index (RSI) has shown a slight increase, moving towards the overbought territory, signaling a potential bullish momentum.
- Stochastic Oscillator: Both %K and %D have been fluctuating, indicating a lack of clear direction in momentum.
- Williams %R: The Williams %R is in the oversold region, suggesting a potential reversal in momentum towards a bullish sentiment.
Volatility Analysis:
- Bollinger Bands: The Bollinger Bands have widened, indicating increased volatility in the stock price.
- Bollinger %B: The %B indicator has shown fluctuations, suggesting potential price reversals or breakouts in the near future.
Volume Analysis:
- On-Balance Volume (OBV): The OBV has shown mixed signals, indicating indecision among investors regarding the stock.
- Chaikin Money Flow (CMF): The CMF has been gradually increasing, suggesting a potential inflow of money into the stock.
Key Observations:
- The trend indicators show a mixed outlook with a slight bullish bias in the mid to long term.
- Momentum indicators indicate a potential bullish sentiment in the short term.
- Volatility indicators suggest increased price fluctuations and potential breakout opportunities.
- Volume indicators reflect indecision among investors but with a slight positive bias.
Conclusion:
Based on the analysis of the technical indicators, the stock price of WELL is likely to experience upward momentum in the coming days. The trend indicators support a bullish view in the mid to long term, while momentum indicators signal a short-term bullish sentiment. The increased volatility may present trading opportunities, and the gradual increase in volume inflow indicates growing investor interest. Therefore, it is recommended to consider buying positions in WELL for potential gains in the near future.