Technical Analysis of WH 2024-05-31
Overview:
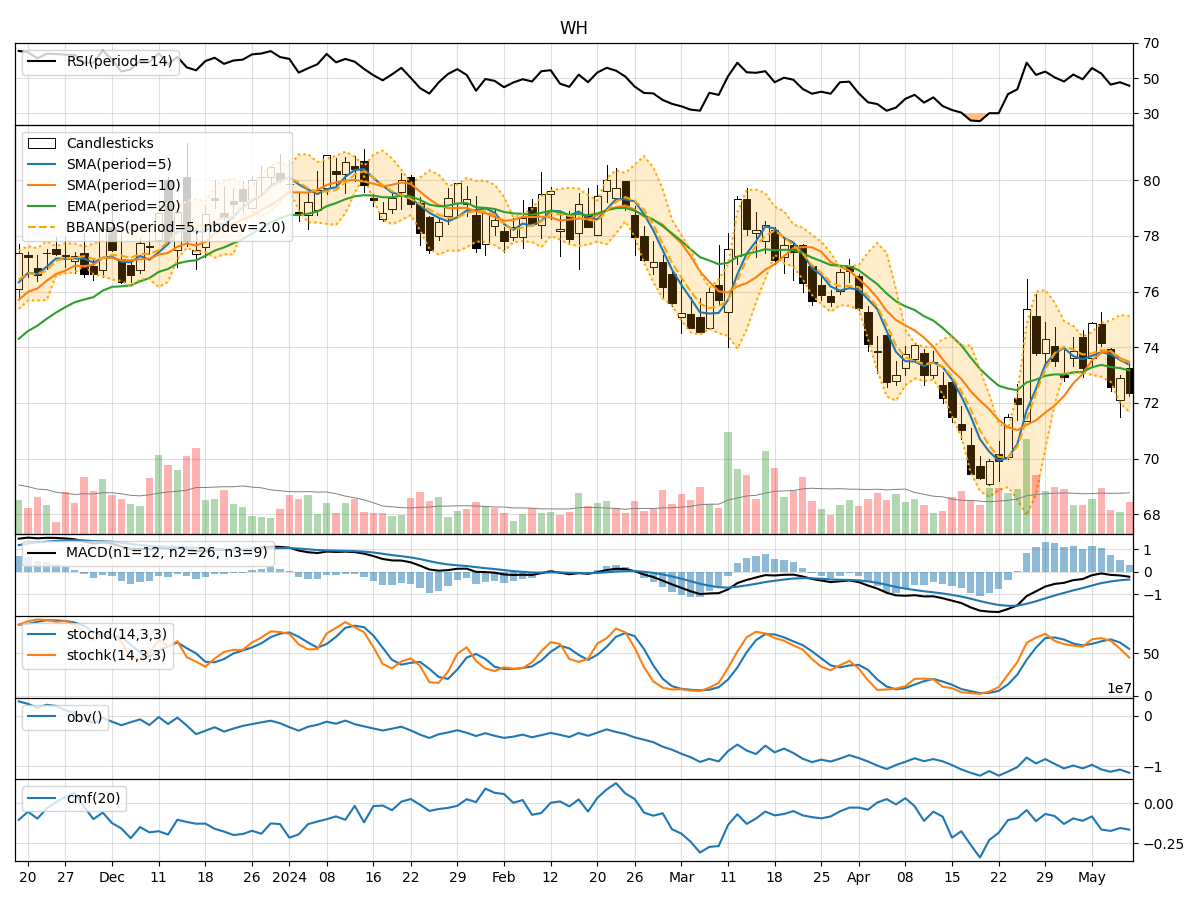
In analyzing the technical indicators for WH stock over the last 5 days, we will delve into trend, momentum, volatility, and volume indicators to provide a comprehensive outlook on the possible stock price movement in the upcoming days.
Trend Analysis:
- Moving Averages (MA): The 5-day MA has been consistently below the closing price, indicating a short-term downtrend.
- MACD: The MACD line has been below the signal line, suggesting a bearish momentum.
- EMA: The EMA has been trending downwards, reflecting a weakening trend.
Key Observation: The trend indicators point towards a bearish sentiment in the stock price movement.
Momentum Analysis:
- RSI: The RSI has been decreasing, indicating a loss in bullish momentum.
- Stochastic Oscillator: Both %K and %D have been declining, signaling a potential reversal to the downside.
- Williams %R: The indicator has been in oversold territory, suggesting a possible bounce back.
Key Observation: Momentum indicators are showing a bearish momentum in the stock.
Volatility Analysis:
- Bollinger Bands (BB): The stock price has been trading below the lower Bollinger Band, indicating oversold conditions.
- Bollinger Band Width (BBW): The BBW has been widening, suggesting increased volatility.
- Bollinger Band %B (BBP): The %B is below 0.2, indicating an oversold condition.
Key Observation: Volatility indicators suggest a highly oversold condition in the stock.
Volume Analysis:
- On-Balance Volume (OBV): The OBV has been declining, indicating selling pressure.
- Chaikin Money Flow (CMF): The CMF has been negative, reflecting a lack of buying interest.
Key Observation: Volume indicators point towards bearish sentiment in the stock.
Conclusion:
Based on the analysis of trend, momentum, volatility, and volume indicators, the overall outlook for WH stock in the next few days is bearish. The stock is likely to experience further downside movement, potentially reaching lower price levels. Traders and investors should exercise caution and consider shorting or staying on the sidelines until a clear reversal pattern emerges.
Key Conclusion:
The technical indicators collectively suggest a strong bearish bias for WH stock in the upcoming days. It is advisable to monitor the price action closely for any signs of a potential reversal before considering any long positions.