Technical Analysis of XYF 2024-05-31
Overview:
In analyzing the technical indicators for XYF over the last 5 days, we will delve into the trend, momentum, volatility, and volume indicators to provide a comprehensive outlook on the possible stock price movement in the coming days. By examining these key aspects, we aim to offer valuable insights and predictions to guide investment decisions.
Trend Analysis:
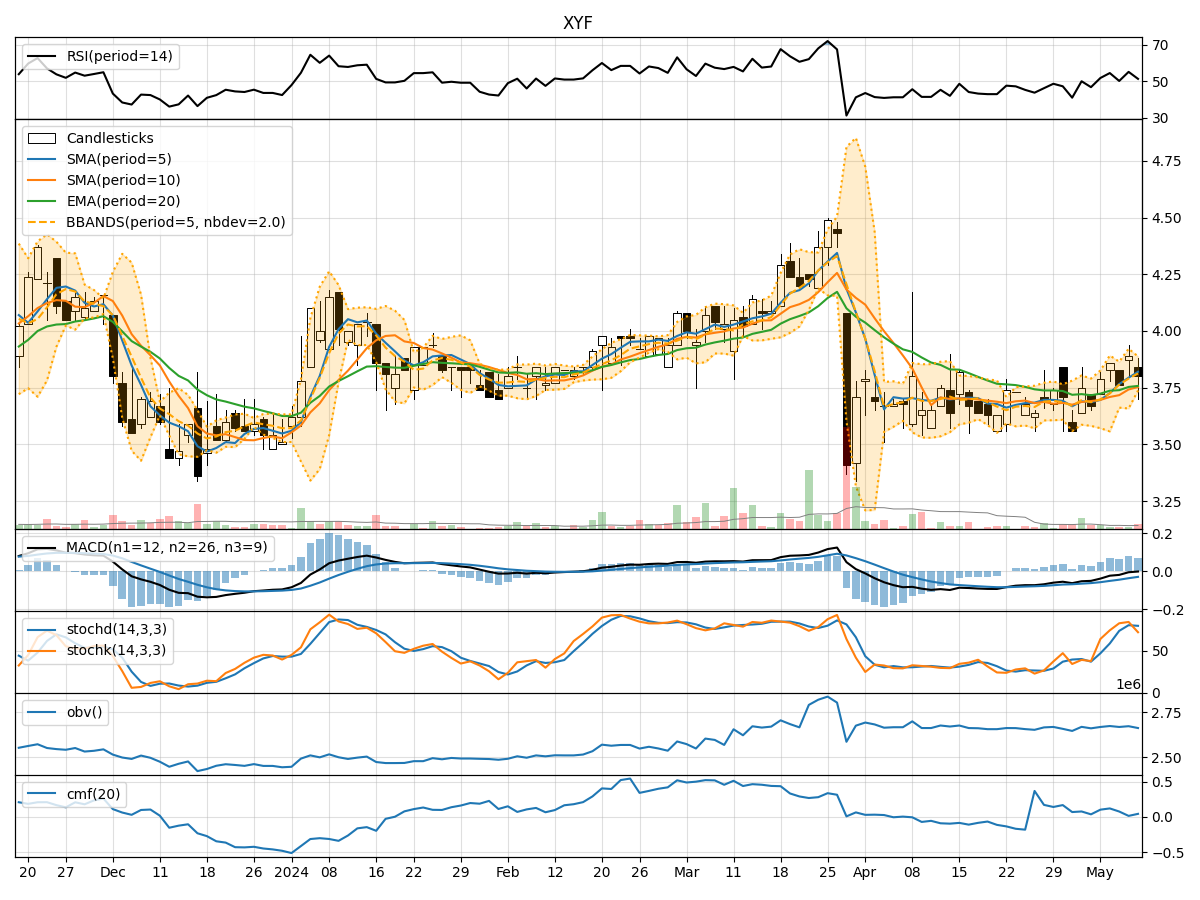
- Moving Averages (MA): The 5-day MA has been fluctuating around the closing prices, indicating short-term price trends. The SMA(10) and EMA(20) have shown a slight downward trend, suggesting a potential bearish sentiment.
- MACD: The MACD line has been positive, with the MACD histogram showing a mix of positive and negative values. This signals a neutral to slightly bullish momentum in the stock.
Momentum Analysis:
- RSI: The RSI has been oscillating around the mid-level, indicating a balanced momentum between buying and selling pressure.
- Stochastic Oscillator: The Stochastics have shown varying levels but are currently in the overbought zone, suggesting a potential reversal or consolidation.
Volatility Analysis:
- Bollinger Bands (BB): The BB bands have widened, indicating increased volatility in the stock price. The current BB% is relatively high, suggesting a potential price reversal or breakout.
Volume Analysis:
- On-Balance Volume (OBV): The OBV has shown mixed movements, reflecting indecision among investors regarding the stock.
- Chaikin Money Flow (CMF): The CMF has been negative, indicating selling pressure in the stock.
Key Observations:
- The trend indicators suggest a slightly bearish sentiment in the short term.
- Momentum indicators show a neutral stance with a potential for a reversal.
- Volatility indicators point towards increased price fluctuations and a possible breakout.
- Volume indicators reflect indecision and selling pressure among investors.
Conclusion:
Based on the analysis of the technical indicators, the next few days' possible stock price movement for XYF is likely to be sideways with a slight bearish bias. Investors should closely monitor the price action for any signs of a breakout or reversal. It is advisable to exercise caution and wait for clearer signals before making significant trading decisions.