Only One True Dividend King: Why Lowe's Currently Outshines Home Depot

Key Takeaways
- Only Lowe's is a formal "Dividend King," with over 60 years of consecutive dividend increases, significantly longer than Home Depot's 16-17 year streak.
- Lowe's trades at a meaningful valuation discount to Home Depot across all major multiples, demonstrating comparable operational efficiency (ROIC) but superior trailing-year cash flow resilience.
- A current, sharp divergence in technical signals strongly favors Lowe's, which shows a bullish-leaning setup, in contrast to Home Depot's uniformly weak and oversold technical picture.
Only One True Dividend King: A Critical Distinction
Home Depot (HD) and Lowe's Companies (LOW) are frequently paired as the dominant forces in home improvement, especially among investors prioritizing dividends. However, a deeper examination reveals a crucial difference in their dividend credentials: only Lowe's holds the prestigious "Dividend King" status. Lowe's has increased its dividend for an impressive 63 to 65 consecutive years, placing it among a select group of companies with over five decades of consistent payout raises. This commitment is underscored by its most recent dividend declaration in May 2026, which saw a 4% increase to $1.25 per share—a materially larger percentage raise than Home Depot's most recent one.
In contrast, while Home Depot boasts a remarkable record of 157 consecutive quarters of dividend payments, spanning nearly 40 years of consistent payouts, its streak of increases is considerably shorter, around 16 to 17 years. This means Home Depot does not meet the 50-year threshold required for Dividend King status. Home Depot's most recent increase was a modest 1.3% to $2.33 per share, declared in February 2026. This distinction is more than a technicality; it reflects different historical patterns of shareholder returns that dividend-growth investors carefully scrutinize.
Both Face Housing Headwinds, But Lowe's Shows Greater Cash Flow Resilience
Both Home Depot and Lowe's operate within the same challenging housing market, with recent management commentary from May 2026 earnings reports reflecting shared headwinds. Both explicitly noted that consumers are "scaling back large remodeling projects" due to "inflation, high mortgage rates and economic uncertainty," leading to a projected "flat" housing market for 2026. Despite these pressures, both companies notably maintained their full-year guidance, signaling confidence in other growth drivers like their Pro customer segments and digital sales.
Operationally, their Q1 FY2026 results highlighted both similarities and crucial differences. Home Depot reported revenue of $41.8 billion, a 4.8% year-over-year increase, while Lowe's posted $23.1 billion in revenue, growing at a faster 10.3% pace from a smaller base. Both companies reported an identical comparable sales growth of +0.6%, suggesting similar core store performance despite differing overall growth rates. Net income also saw nearly identical declines over the trailing twelve months (TTM), with both experiencing a 4.4% year-over-year reduction, indicating shared income statement pressures.
A critical divergence emerges in cash flow generation, however. Over the trailing twelve months, Home Depot's operating cash flow experienced a significant 17.6% year-over-year decline, with free cash flow falling by 22.5%. In contrast, Lowe's demonstrated greater resilience, with its operating cash flow actually growing by 2.5% year-over-year, and free cash flow remaining largely flat, down only 0.6%. This stronger cash flow performance from Lowe's suggests a more robust financial footing amidst the current economic pressures.
Lowe's Offers a Clear Valuation Discount with Aligned Operational Efficiency
Comparing the valuation of these two home improvement giants reveals Lowe's consistently screens as more attractive than Home Depot across standard multiples. Lowe's currently trades at a price-to-earnings (P/E) ratio of 18.4 times, significantly lower than Home Depot's 24.0 times. This discount extends to other key metrics: Lowe's enterprise value-to-EBITDA (EV/EBITDA) is approximately 13.5 times, compared to Home Depot's 16.3 times, and its price-to-free cash flow (P/FCF) stands at about 16 times, well below Home Depot's 23.6 times. Its price-to-sales (P/S) ratio of 1.39 times also undercuts Home Depot's 2.03 times, indicating a pervasive valuation gap.
Despite this valuation disparity, both companies demonstrate comparable efficiency in converting capital into profits. Lowe's slightly outperforms Home Depot in return on invested capital (ROIC), achieving 21.2% versus Home Depot's 20.4%. Operating margins are also closely aligned, with Home Depot at 12.4% and Lowe's at 11.5%, while gross margins show Lowe's with a marginal edge (33.8% vs. 33.1%).
It is worth noting that certain valuation metrics like price-to-book (P/B) and return on equity (ROE) present anomalous readings for both companies, particularly Lowe's, which shows a negative book value per share. These figures, such as Home Depot's 24.3x P/B and 113.3% ROE, and Lowe's negative P/B and -64.8% ROE, are artifacts of decades of aggressive share buybacks. These repurchase programs have significantly reduced the companies' book equity, in some cases pushing it below zero, making P/B and ROE mathematically uninterpretable. As such, ROIC serves as a more reliable measure for comparing their operational profitability and capital efficiency.
Home Depot's Bold Bet on the Pro Market
While Lowe's offers a valuation advantage and stronger cash flow, Home Depot distinguishes itself with a more pronounced and strategically articulated focus on the professional (Pro) contractor market. Home Depot’s Pro/B2B revenue is now nearing 50% of its total revenue, a level significantly higher and more transparently disclosed than Lowe's provides for its own Pro segment. This commitment is supported by substantial investments, including the 2024 acquisition of SRS Distribution for approximately $18.25 billion, followed by SRS's further acquisitions in the specialty distribution channel.
In a pivotal move on July 30, 2026, Home Depot announced a company-wide organizational realignment. This included the creation of an "Office of Pro Acceleration" led by its CFO, designed to integrate its various Pro-focused businesses, including Home Depot Pro, HD Supply, and SRS. This structural overhaul explicitly targets a $1.2 trillion total addressable market, with $700 billion dedicated specifically to Pro customers, representing a major, recent structural bet on the contractor segment.
Lowe's also identifies the Pro segment as a "core growth driver," and its Q1 FY2026 results were partly attributed to "continued growth in sales to professional contractors." However, Lowe's does not disclose an exact percentage of Pro revenue. Lowe's "Total Home" strategy, announced in December 2024, emphasizes Pro penetration alongside online sales (which grew 15.5% in Q1 FY2026), home services, and expanded product assortments, including extensions to 150 more stores. While both pursue the Pro customer, Home Depot’s recent organizational moves and explicit revenue share illustrate a more concentrated and advanced strategic positioning.
Analyst Sentiment Favors Lowe's with Higher Upside and Less Bearish Dissent
Current analyst sentiment, while positive for both companies, signals a more pronounced upside and less disagreement for Lowe's. Home Depot's consensus price target currently sits at $374.00, implying approximately 10.4% upside from its current price of $338.86. While the overall rating consensus for Home Depot is a "Buy" from 62 analysts, the split reveals open disagreement: 36 analysts rate it a Buy, 21 as Hold, and notably, 4 analysts maintain a Sell rating. This presence of multiple Sell ratings is unusual for a large-cap stock and suggests genuine reservations among the analyst community. Some bearish calls stemmed from target cuts around May 2026, citing weak big-ticket remodel demand.
For Lowe's, the picture is more consistently bullish. The consensus price target is $270.63, implying a substantial upside of roughly 23.9%—more than double that of Home Depot—from its current price of $218.47. The analyst rating consensus for Lowe's is also a "Buy" from 51 analysts, but with a more lopsided distribution: 31 analysts recommend Buy, 19 recommend Hold, and only 1 maintains a Sell rating. This indicates a far stronger consensus and less bearish dissent compared to Home Depot. Sentiment for both names has recovered somewhat since the target changes that followed their Q1 earnings reports, with Lowe's even seeing an upgrade to Buy from Citigroup in May 2026. The present analyst landscape suggests Lowe's carries greater confidence for future price appreciation.
Sharply Divergent Technical Signals Point to Greater Strength in Lowe's
The current technical picture presents one of the sharpest divergences between Home Depot and Lowe's, clearly favoring Lowe's in the near term. Home Depot's technical signal set is uniformly weak and suggests short-term overextension to the downside. The stock currently registers three simultaneous oversold oscillator readings (stochastic, Williams %R, and CCI). Additionally, it carries nine distinct bearish indicators, including a bearish trend strength (ADX), a Supertrend sell signal, a confirmed downtrend, underperformance relative to the broader market, expanding average true range, an accumulation/distribution downtrend, falling on-balance volume (OBV), trading below its volume-weighted average price (VWAP), and a falling VWAP itself. A broader scan of technical signals indicates a heavily bearish outlook, with 6 buy signals against 18 sell signals.
In contrast, Lowe's technical read is significantly more robust and leans bullish. The stock shows two clear bullish flags: an accumulation/distribution uptrend and trading above its VWAP. While it shares some bearish signals with Home Depot—such as a bearish ADX, Supertrend sell, and underperforming the market—these are fewer and less pervasive. Lowe's also shows falling on-balance volume, indicating some volume weakness, and one overbought condition (Stoch RSI), but critically, it has no concurrent oversold readings. The broader technical scan for Lowe's shows a bullish-leaning picture, with 12 buy signals against 7 sell signals. This stark difference suggests Home Depot faces significant near-term pressure and potential downside momentum, while Lowe's demonstrates more underlying strength and potential for near-term outperformance.
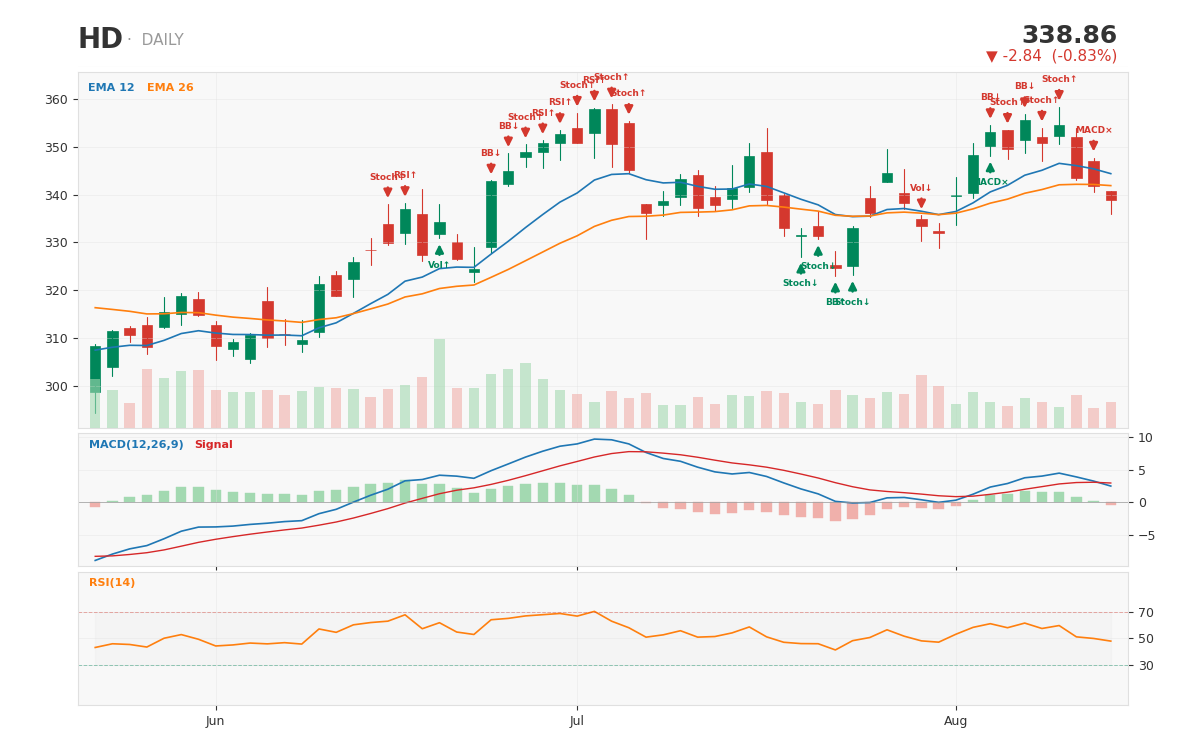 Home Depot 1-year daily chart with technical signals -- a uniformly bearish picture, 6 buy vs. 18 sell on the broader scan
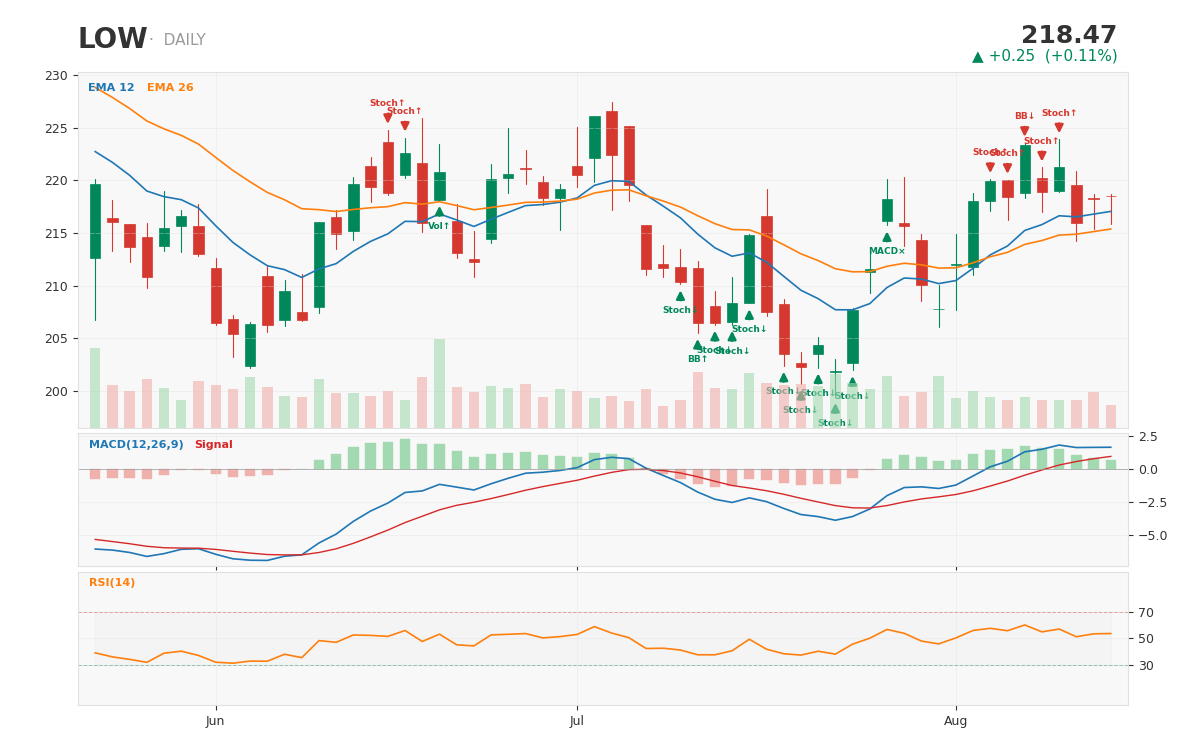 Lowe's 1-year daily chart with technical signals -- a bullish-leaning picture, 12 buy vs. 7 sell on the broader scan
Explore this yourself: See the full technical signal breakdown for any stock
Verdict: Lowe's Offers Compelling Relative Value Amidst Market Headwinds
Lowe's presents a more compelling relative value proposition compared to Home Depot, particularly for investors seeking dividend pedigree, stronger cash flow resilience, and a more favorable near-term technical outlook. While Home Depot's aggressive strategic pivot towards the Pro market is a significant long-term growth lever, its current valuation, cash flow dynamics, and widespread technical weakness suggest potential for continued underperformance in the immediate future. Lowe's, as a confirmed Dividend King, offers a deeper discount on valuation multiples, superior trailing-year cash flow generation, a more enthusiastic analyst consensus, and a considerably healthier technical setup that indicates greater resilience.
For investors considering an entry into Lowe's, a sensible entry zone would be in the range of its recent lows, between $215 and $218. This level aligns with recent price action and could offer a consolidation point following its technical improvements. Looking out over the next twelve months, the 12-month target for Lowe's is set at the analyst median of $265.00, representing substantial upside from current levels. A critical invalidation level for this thesis would be a sustained break below Lowe's 52-week low of $199.40, which would signal a more profound shift in market sentiment or an unexpected deterioration in its operational performance that would warrant a reassessment. Lowe's currently offers a more attractive blend of value and near-term momentum for navigating the ongoing uncertainty in the home improvement sector.
Want deeper research on any stock? Try Kavout Pro for AI-powered analysis, smart signals, and more. Already a member? Add credits to run more research.