How Kavout is using AI to help analysts augment factor-based asset selection

We recently spoke with Isabell, Kavout’s Chief Commercial Officer, to discuss factor-based asset selection methods which include traditional approaches to developing them, and some new solutions Kavout has developed to make analysts smarter and getting better at what they do.
Where does the concept of the factor model come from?
The concept of the factor model can be traced back to over a half century ago. After Harry Markowitz’s pioneering work in 1952 with the Modern Portfolio Theory, which infers that investors can optimize their portfolio according to the “expected returns-variance of returns” criterion, William Sharpe developed the Capital Asset Pricing Model (CAPM) in 1964. The CAPM model is also known as the single market factor model, which associates the expected excess return of a single asset with the expected excess return of market.
Since asset returns can be associated with market returns, people will naturally wonder whether there are other influencing risk factors. In 1976, Stephen Ross expanded the CAPM model with the arbitrage pricing theory (APT) and indicated the multi-factor model, in which an asset’s return is explained by several macro-economic factors.
Later on, many empirical studies were conducted to find the factors that drive a stock’s return. The famous factor models are the Fama-French 3-factor model (1996), the Carhart 4-factor model (1997) and the Fama-French 5-factor model (2015).
The factor model can be used to explain either an individual security or a portfolio of securities. It does so by comparing one or more factors to analyze relationships between variables and the resulting performance.
How do analysts seek effective factors to instruct investment?
A common practice of a factor model is asset selection. The development of factor models has brought about new methodologies for quantitative investing. For example, quant analysts research potential factors and examine the factor’s significance on asset return. Those factors are usually based on certain economic or financial theories. Some might come from empirical study, and others are found by data-mining. If factors are observed to be effective, analysts will rank stocks according to those factors and include the top group into their portfolio.
You compare this process to the Sisyphus myth. Why?
Up until now, there have been a tremendous number of factors found or created. But depending on market conditions, factors that seem to perform well in the past can turn around and perform poorly the next period. Therefore, analysts have to keep working the trial-and-error method and either come up with new factors or retest existing factors. When a factor that works stops working, they need to start all over again.
Just like Sisyphus pushing the boulder up the mountain only to have it roll back down.
Exactly. In a high-dimensional financial market, even a sophisticated analyst cannot exhaustively explore all the factors. As the rules of the game change every day, it is impossible for humans to catch every subtle shift of factors in time.
What has Kavout developed to address this challenge?
At Kavout, we value factor-based investing. In fact, we group our internal research into four categories: Quality, Value, Growth, and Momentum. But we don’t stop there. Beyond the four factors, we take into account macro and micro market data, technical indicators and more to formulate a comprehensive evaluation of a company.
Our evaluation is then summarized into a single number – a K Score, which assign stocks with scores from 1 to 9. The higher the score, the greater the probability of a stock going up in the next 30 days. Think of it as a buy signal. We recommend managers to short stocks that are rated with lower K Scores.
K Score is available for over 3,000 tradable equities in the US, and for over 800 active equities for China A Share stocks. K Score will be available for other markets soon.
Can you expand on how machine learning plays a part in this?
Sure. What’s behind K Score is Kavout’s underlying process and technology that we call the Kai Intelligence Platform. It takes in a wide array of data sources and converts datasets from unstructured to structured so they are amendable for analysis. We run these datasets through machine learning and deep learning models, coupled with algorithms we developed to produce K Score at scale.
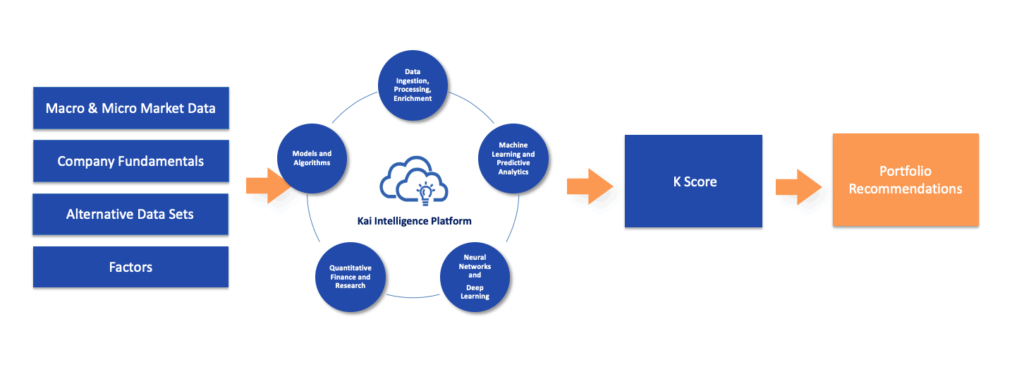
Figure 1: Illustration of Kai Intelligence Platform taking in a variety of datasets and factors to produce K Score, which can be used to assist asset selection for portfolio design.
The key here is doing it at scale. Machines can process certain information faster than humans, at a greater volume within a limited time than humans, and probably at a lower cost as well. Going back to the Sisyphus analogy, why have analysts go through the time-consuming process of discovery, trial-and-error and rebalancing when computers can help?
Many portfolio managers have relied on K Score for asset selection and portfolio creation. To view a few examples, please visit our K Score page and Model Portfolios page.
Send us a Message
Contact us
Contact us today to learn more about Kavout's products or services.