MarketLens

Log in

How to Master the RSI Indicator for Smarter Trading

10 months ago
SHARE THIS ON:

225052802.png If you've been exploring technical analysis, you've probably heard of the Relative Strength Index, better known as RSI. Developed by J. Welles Wilder Jr. back in 1978, RSI remains one of the most trusted indicators for traders looking to understand market momentum and spot potential turning points.

But what exactly is RSI, and how can you use it effectively in your trading? Let’s simplify things.

What Exactly Is RSI?

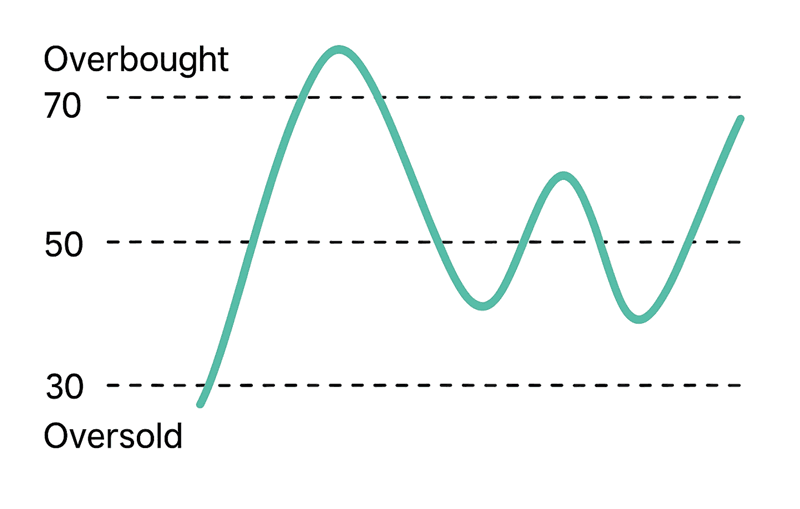
In simple terms, the RSI is a tool that measures how fast and how much the price of an asset has changed recently. It converts these changes into a score between 0 and 100. This score helps traders quickly see whether an asset is becoming "overbought" (too expensive) or "oversold" (too cheap).

Originally, calculating RSI involved complex manual math, but today’s trading software does all the heavy lifting, making RSI easily accessible for stocks, crypto, forex, and more.

Breaking Down the RSI Calculation (Simply!)

Without getting too technical, RSI looks at the average gains and average losses over a certain period—usually 14 days. If prices rise consistently, RSI climbs toward 100; if they fall, it drops toward 0.

Here's the simplified formula:

  • Calculate average gains and average losses over the chosen timeframe.
  • Divide average gains by average losses to get "relative strength" (RS).
  • Convert RS into RSI: RSI = 100 - (100 / (1 + RS)).

Shorter periods (like 7 days) make RSI react faster, which might suit day traders. Longer periods (like 21 days) smooth out signals, suitable for longer-term investors.

How to Read RSI Levels: The Basics

The RSI score is straightforward:

  • Above 70 means the asset is likely overbought (prices rose too fast, might correct soon).
  • Below 30 means the asset is probably oversold (prices dropped too fast, might rebound soon).

But here's a pro tip: don’t overlook the midpoint at 50. This level tells you if the bulls (buyers) or bears (sellers) are in charge. Above 50 generally means bullish momentum, below 50 suggests bearish sentiment.

The Market Psychology Behind RSI Extremes

Ever wonder why prices sometimes rocket upwards or plunge dramatically? It often boils down to emotions—greed and fear.

When RSI is above 70, traders might be overly optimistic, thinking prices will keep climbing forever. Eventually, smart traders sell to lock in profits, causing prices to pull back.

When RSI drops below 30, panic selling often takes hold. But as fear peaks, contrarian investors step in, sensing a good buying opportunity, driving prices back up.

Adapting RSI for Different Markets

RSI’s default overbought (70) and oversold (30) thresholds aren't set in stone. You should adjust these based on the type of market you’re trading:

  • Bullish markets: RSI might rarely dip below 30. Consider using 40-50 as "oversold."
  • Bearish markets: RSI might rarely go above 70. Consider 60 as "overbought."
  • Crypto or volatile markets: Use more extreme thresholds like 80/20 or even 90/10 to filter noise.

Being flexible helps prevent false signals that happen when rigidly sticking to default settings.

Essential RSI Trading Strategies

Strategy 1: Basic Reversals ("Buy the Dip, Sell the Rally")

The simplest strategy:

  • Buy when RSI crosses back above 30 (suggesting oversold).
  • Sell when RSI drops back below 70 (indicating overbought).

This works best in sideways markets where prices bounce between clear support and resistance levels.

Strategy 2: Confirming Trends

RSI isn’t just for reversals. It can also confirm ongoing trends:

  • In uptrends, look for RSI dips to around 50 for buying opportunities.
  • In downtrends, watch for RSI peaks near 50-60 to find selling opportunities.

Using RSI this way aligns you with the market’s dominant direction, rather than fighting against it.

Advanced RSI Techniques

Divergence: Spot Hidden Momentum Shifts

Divergence occurs when price and RSI move differently:

  • Bullish Divergence: Prices make lower lows, but RSI makes higher lows. This signals weakening selling pressure—a potential buy signal.
  • Bearish Divergence: Prices make higher highs, but RSI forms lower highs, suggesting weakening buying pressure—a potential sell signal.

Divergence is powerful but always wait for confirmation from actual price moves.

Failure Swings: High-Confidence Signals

Failure swings use RSI alone (no price needed):

  • Bullish Failure Swing: RSI drops below 30, rises, dips again (but stays above 30), then breaks above the previous RSI high.
  • Bearish Failure Swing: RSI climbs above 70, falls, rises again (below 70), then breaks below the previous RSI low.

These swings often predict strong reversals.

Boosting RSI Signals with Other Indicators

RSI works best when combined with other technical tools:

  • Moving Averages: Confirm trends. Trade RSI signals in the direction of the trend identified by the moving average.
  • MACD: Crossovers in MACD confirm RSI signals, adding reliability.
  • Bollinger Bands: RSI extremes paired with Bollinger Band touches highlight powerful reversal points.
  • Support & Resistance Levels: RSI signals aligning with key price levels greatly improve accuracy.
  • Volume: Rising volume confirms RSI signals, indicating stronger conviction behind the move.

Using Multiple Timeframes

Always start with the larger picture (daily or weekly RSI) and drill down to smaller charts (4-hour, 1-hour) for precise entries. This layered approach filters noise and enhances trade reliability.

Wrapping Up: The Art of Using RSI

RSI is a fantastic tool—but not perfect. It shines brightest when you:

  • Adjust it based on market conditions.
  • Combine it with other indicators and strategies.
  • Understand market psychology.

Remember, trading successfully is about blending tools like RSI with sound judgment and market awareness. That’s how you transform RSI from a simple oscillator into a powerful part of your trading arsenal. To start using RSI signals and combining them with various indicators, check out Kavout Smart Signals.

SHARE THIS ON:

Related Articles

Category

You may also like

Crypto News1 week ago

How to track Bitcoin prices: tools, steps, and pro tips

This guide outlines real-time Bitcoin price tracking tools and advanced analytics to help investors avoid data errors. It provides step-by-step setup instructions and professional tips for monitoring ...
Forex News1 months ago

USD/CHF Price Forecast: Traders eye 0.7800 as RSI turns bullish

USD/CHF traders are targeting the 0.7800 level after the Relative Strength Index (RSI) indicator turned bullish, suggesting potential upward momentum.
News1 months ago

How To Exploit Nasdaq Pullbacks With Internal Bar Strength (IBS) Indicator: A Short-Term Quantitative Strategy

A short-term quantitative strategy develops a mean reversion approach for a stock basket, utilizing the Internal Bar Strength (IBS) indicator to time entries after bearish moves and exit near equilibr...
Stock News1 months ago

Just Set It and Forget It With These Dividend Stocks

The snippet suggests that seasoned investors understand the value of dividend stocks, implying that some traders may need to learn this lesson through experience.

Breaking News

View All →

Top Headlines

View More →
Stock News1 hour ago

Ascent Group LLC Has $36.68 Million Stock Position in Meta Platforms, Inc. $META

Stock News1 hour ago

Applied Capital LLC FL Has $1.51 Million Stake in Amazon.com, Inc. $AMZN

Stock News1 hour ago

Arta Finance Wealth Management LLC Buys Shares of 12,555 Meta Platforms, Inc. $META

Stock News1 hour ago

Apollon Wealth Management LLC Raises Holdings in Invesco QQQ $QQQ

Stock News1 hour ago

25 LLC Grows Position in Apple Inc. $AAPL