


Stock News•2 weeks ago
Quality Stocks Aren't the Names You'd Expect
High-quality stocks are not easily identifiable by conventional metrics, challenging the assumption that quality investing is straightforward.
In the last blog we looked at the Quality Factor without looking at any particular sectors or time horizons. In this entry, we break down the data and see how different Quality factors perform across different sectors.
To remind you, for this demonstration we constructed a portfolio based on three key sub-factors: profit, growth and safety. To test the performance of our quality portfolio, we back tested the ten portfolios over the period January 1, 2004 to August 31, 2019. The portfolio was rebalanced quarterly using a market-cap weighted method, with 20 basis points deducted as costs per transaction.
Like the last blog entry, we provide information on individual (Quality_Growth, Quality_Profit, Quality_Safety) and composite Quality Factors (Quality_Composite).
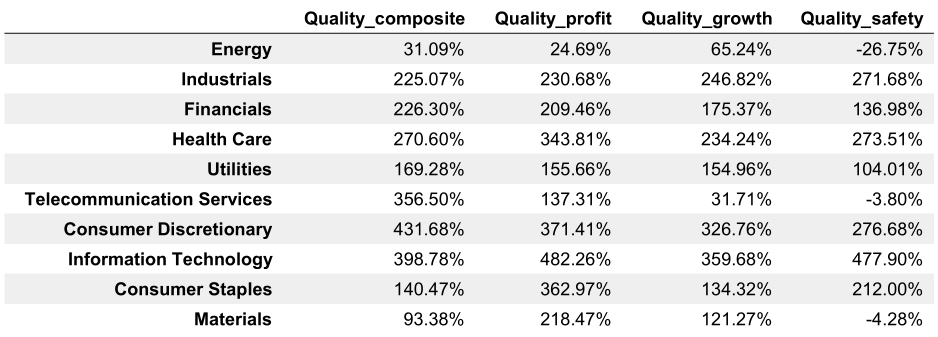
The heat map below is the portfolio for the different value factors based on sector, and what becomes immediately evident is that there are several sectoral biases. In this scenario the Industrials, Consumer Discretionary and Industrial sectors perform well.
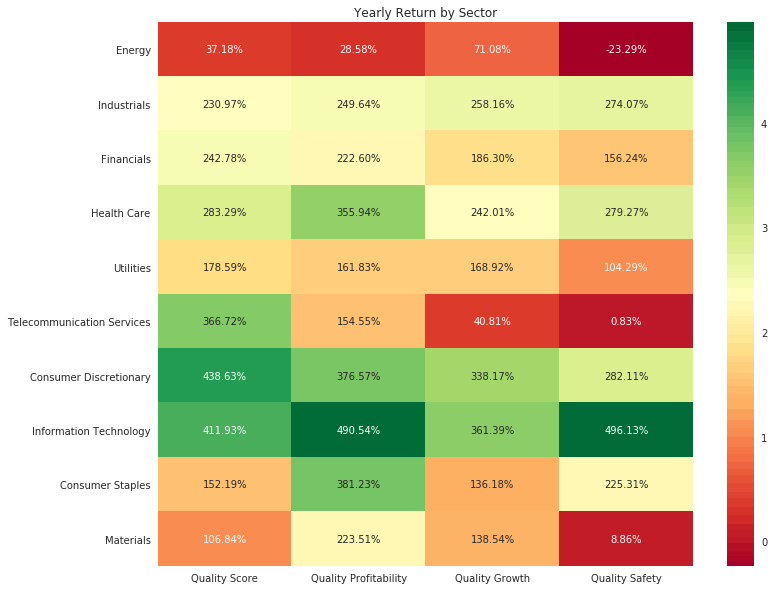
What we notice below is that the Quality_Composite portfolio, the Quality_Profit portfolio, and the Quality_Growth portfolios all generated positive returns for every sector over the time period. This suggests that no matter which industry an investor is focused on, these quality strategies can add value. However, at sector level, the safety sub-factor portfolio did generate negative performances for three sectors (Energy, Telecommunication Services, and Materials).
We also ran the sector breakdowns to adjust for volatility. To see our analysis looking at the Sharpe Ratio and Maximum Drawdown across the sectors, or even the performance of the sector of your choice, please click below.
Kavout has the luxury of being able to break down information according to the specific needs of the investor. Click here to read our blog on the Quality Factor by Time Horizons.