


Stock News•2 weeks ago
Quality Stocks Aren't the Names You'd Expect
High-quality stocks are not easily identifiable by conventional metrics, challenging the assumption that quality investing is straightforward.
In the previous two blogs we looked at Quality from a high level and from a sector perspective. In this entry, we are looking at Quality from a time horizon.
As a refresher, for this demonstration we constructed a portfolio based on three key sub-factors: profit, growth and safety. To test the performance of our quality portfolio, we back tested the ten portfolios over the period January 1, 2004 to April 30, 2019. The portfolio was rebalanced quarterly using a market-cap weighted method, with 20 basis points deducted as costs per transaction.
Like the last two blog entries, we provide information on both individual and composite Quality Factors.
Below is a heat map demonstrating the yearly return based on the Quality individual and composite factors.
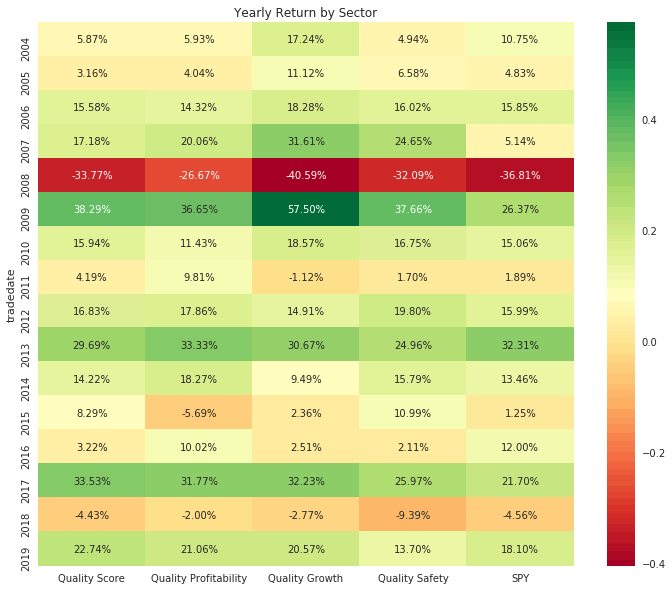
What’s interesting about this heatmap is that it clearly shows that the different sub-factors of the quality factor drove outperformance at different times.
During the best years for the S&P 500 over the period, the Quality_Growth portfolio performed well. However, the results were very different in the years in which the S&P 500 generated low or negative returns. This suggests that investors gravitated towards high quality stocks that were regarded as safe.
The takeaway here is that the different components of a quality strategy are likely to drive outperformance at different times. When investors are bullish, they will focus more on growth. However, during periods of uncertainty, they are more likely to focus on stocks that offer safety and reliable profits.
Being able to look at the Quality Factors through different lenses like time horizons is a strength of Kavout: our specialty lies not only in the breadth and depth of data, but also the ability to offer new perspectives and slice-and-dice the information according to your needs. By doing this, we are not trying to replace the human investor – we strive to make the human investor better.
Are you interested in seeing the latest performance of the quality factor for the US stock market? Click below to learn more and download sample data for the quality factor.