HON – The Breakup Is Done, Aerospace Crashed on Its Own, and Automation Is What's Left

Key Takeaways
- Honeywell's three-way split is complete: Aerospace (HONA) spun out June 29, the PSS unit sold August 3, and what remains is a pure-play automation company trading as Honeywell Technologies (HON) – yet the stock has fallen 51.5% in six months, leaving a massive disconnect between the fundamental story and the tape.
- The spun-out aerospace unit cratered 20%+ on its first independent earnings report and cut forward guidance – an outcome that validates management's decision to keep the higher-growth automation business, though a contrarian read argues HONA's issues are supply-side, not demand-side, with an $18.2 billion backlog.
- Honeywell Technologies' own Q2 showed orders growing 16% year over year against just 4% revenue growth, a $20 billion backlog, and a 22%+ margin target – but every single technical signal on the stock is bearish, and the AI composite score sits at a neutral 49, creating a rare tension between improving fundamentals and a damaged price structure.
The Breakup's First Verdict: HONA Crashed, and That Matters for HON
The industrial conglomerate breakup that investors had watched for two years became reality on June 29, when Honeywell Aerospace (NASDAQ: HONA) began trading independently. The final piece fell into place August 3, when Honeywell Technologies sold its Productivity Solutions and Services business to Brady Corporation. Chairman and CEO Vimal Kapur called that sale "the final step toward completing our transition to a pure-play automation company," squarely focused on building, industrial, and process sectors.
The early market verdict on the split has been brutal – and revealing. HONA cratered more than 20% on August 5 after reporting its first quarterly results as a standalone company, a weak Q2 that included a cut to the full-year outlook. Net income of $300 million on $4.5 billion in sales, with growth slowing to 5%. The source that reported this crash explicitly noted that the underperformance "somewhat validates the strategy of Honeywell International to focus on stronger units of growth."
That is a loaded statement for HON holders. The discarded aerospace piece – the one that many investors considered the crown jewel – stumbled out of the gate. The remaining automation company now carries the burden of proving it was the smarter bet. But the crash also provides a useful narrative anchor: if HONA's struggles are real, then HON's automation-focused future looks comparatively stronger. If HONA's weakness is merely a supply-constrained transition year (backlog of $18.2 billion, double-digit order momentum, reaffirmed 2030 targets, per a separate analysis), then the market may be overreacting to a temporary blip. Either way, the split has created a cleaner way to judge each piece on its own merit.
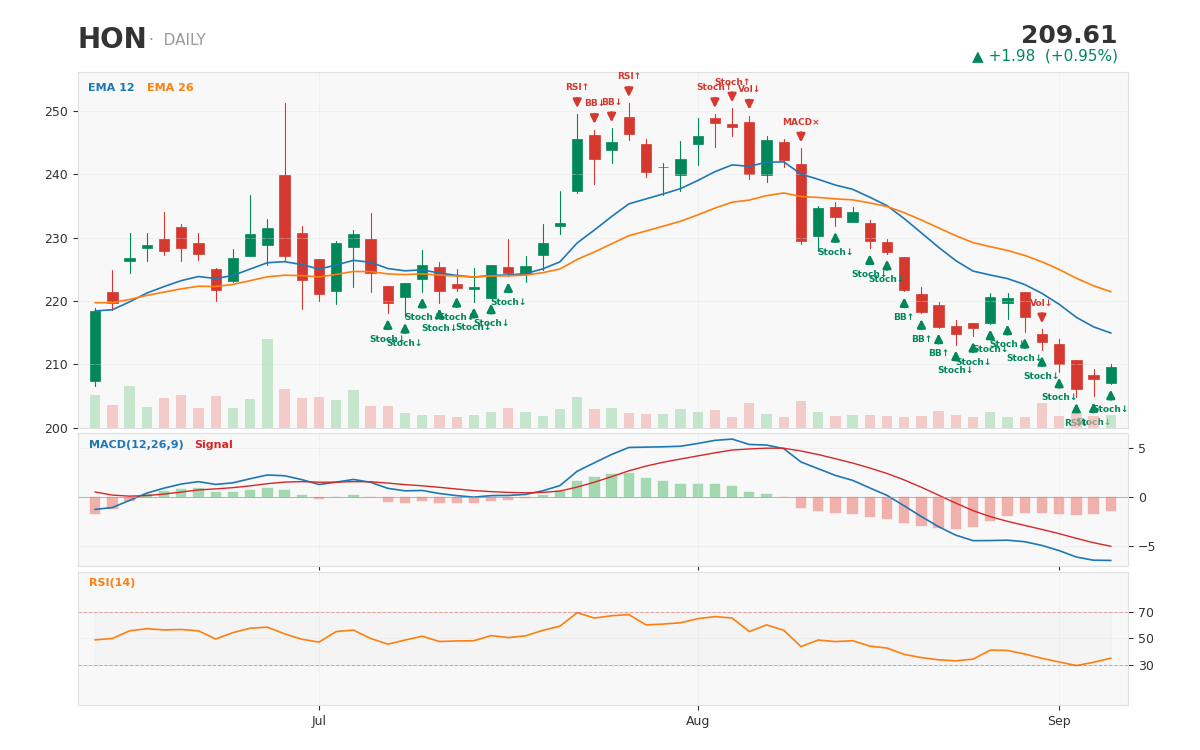 HON 1-year daily chart with technical signals -- captured after the completed three-way breakup left Honeywell Technologies as a pure-play automation company, with the spun-out aerospace unit having crashed 20%+ on its own first print
The Automation Bull Case: Orders, Backlog, and Data Center Tailwinds
Honeywell Technologies reported its own Q2 on July 23, and the numbers tell a story of a company in transition – but with leading indicators pointing up. Revenue came in at $5.2 billion, up 4% organically. Adjusted EPS of $1.95 grew 10% year over year. Free cash flow jumped from $100 million to $500 million.
The most important number, however, is orders: they grew 16% year over year in Q2, quadruple the revenue growth rate. That divergence – orders far outstripping sales – is the classic setup for a revenue acceleration as the backlog converts. And the backlog is indeed large: $20 billion, up 9% from a year ago. The company is targeting 22%+ segment margins by the end of fiscal 2026, up from current levels, and has guided for 15% EPS growth in 2027.
The growth driver getting the most attention is Building Automation, which is benefiting from data center construction demand. That is not a speculative AI-hype narrative; it is a real capex cycle that industrial controls companies are already booking. Process Automation, meanwhile, has been a drag, with lower catalyst shipments and project delays persisting. But the overall order momentum suggests the backlog conversion is real, and the margin expansion path is credible.
The Tape That Hasn't Believed It: Technical Signals and a 51.5% Decline
Despite the fundamental story, Honeywell Technologies' stock has been in a sustained downtrend. Over the past six months, HON has lost 51.5% of its value, closing at $209.61 on September 4. That is well below the 52-week high of $260.28 and just $14 above the low of $195.87.
The technical picture is uniformly bearish. Every curated signal – trend strength, moving average convergence/divergence, on-balance volume – is pointing lower. The trend-strength reading has turned bearish, volume is confirming the decline, and momentum oscillators are negative. The overall technical rating sits at 31 out of 100. The AI composite score, which blends fundamental, technical, and quantitative factors, is at a neutral 49 – hardly a vote of confidence. Most notably, the momentum average is at zero, indicating an absence of directional conviction in the price trend, which is unusual for a stock that has fallen more than 50%.
This is the central tension: a company with a $20 billion backlog, double-digit order growth, and a 15% EPS growth target is trading at 8.1 times trailing earnings and a 3.7% dividend yield, yet the tape is treating it as if the business is deteriorating. The question is whether the technical damage is a lagging indicator of a genuine slowdown or a buying opportunity created by sentiment overshoot.
Who Is Buying, Who Is Selling – and What It Means
The smart-money picture is mixed but revealing. The most notable insider transaction was an option-exercise sale by director Ken West in July, netting $4.2 million and reducing his direct holdings by 89%. The timing, however, coincides with his departure from the board on August 31 – the sale is more likely a clean-up move tied to his exit than a bearish signal about the company's prospects.
Institutional ownership is broad and deep. The largest guru position is held by T. Rowe Price at 2.27 million shares, followed by positions from Ken Griffin's Citadel, PRIMECAP, Jim Simons' Renaissance Technologies, and George Soros. That is a strong bench of value and quantitative investors. The fact that multiple independent quant strategies are holding HON – including both value-oriented and momentum-oriented funds – suggests that the models see a valuation gap that the technical tape has not yet closed. The absence of panic selling among large holders argues that the institutional base is staying patient.
Valuation vs. Consensus: A 25% Upside That the Market Is Ignoring
On a trailing basis, Honeywell Technologies trades at a price-to-earnings ratio of 8.1, an enterprise value-to-EBITDA multiple of 7.3, and a price-to-sales ratio of 1.8. The free cash flow yield is 6.2%. For a company targeting 15% EPS growth and 22%+ margins, these multiples are deep value territory.
The sell-side is nearly unanimous in seeing upside. The consensus price target is $261.82, with a median of $263.00, representing roughly 25% upside from the current $209.61. The range runs from a low of $239 to a high of $293. Of 30 analysts, 20 rate it a Buy and 10 a Hold; there are no Sells. BofA upgraded the stock from Underperform to Neutral on July 28, setting a $265 target, citing "stronger execution, broad-based order growth and increased 2026 guidance." Morgan Stanley maintains Equal Weight, while RBC Capital rates it Outperform.
The gap between analyst optimism and the stock's price action is unusually wide. A 25% upside from consensus targets is rare for a stock that has already fallen 50% – it implies either the analysts are wrong or the market is pricing in a deterioration that hasn't materialized in the orders and backlog data.
| Metric | Value |
|---|---|
| Trailing P/E | 8.1x |
| EV/EBITDA | 7.3x |
| Price/Sales | 1.8x |
| Dividend Yield | 3.7% |
| FCF Yield | 6.2% |
| Consensus Target | $261.82 (25% upside) |
| Analyst Split | 20 Buy / 10 Hold |
The Risks That Could Prove the Tape Right
The bull case depends on backlog conversion and margin expansion. The risks are that those don't materialize. Process Automation weakness has persisted, with lower catalyst shipments and project delays. The company's own investor event in Chicago in August disappointed the market, sending the stock down 5% that day. Leadership churn in the PSS and Process divisions adds execution risk. And while the order growth is impressive, converting a $20 billion backlog into revenue at high margins is not automatic – especially if industrial demand softens or data center buildouts slow.
There is also the question of whether the stock's decline is a rational repricing of a company that is now smaller and less diversified than the old Honeywell. The spin-off of Aerospace removed a high-margin, aftermarket-heavy revenue stream. The PSS sale removed another earnings contributor. What remains is a pure-play automation company with a higher cyclical exposure. At 8x earnings, that cyclical risk may already be priced in, but if the economy slows further, multiples could compress more.
Verdict: The Setup Is Compelling, but the Tape Must Be Respected
This is a stock where the fundamental story and the technical picture are in direct conflict – and in such cases, the tape usually wins in the short term. But the evidence here is unusually skewed toward the bull case at current prices.
Stance: Buy on weakness, with the first meaningful entry near $200, which sits just above the 52-week low of $195.87. The technical damage suggests no urgency to chase; let the stock prove it can hold above that level before committing.
Entry zone: $195 to $205. That zone covers the 52-week low and the area where the stock has found temporary support in recent weeks. A break below $195 would invalidate the technical floor and suggest further downside to the $180 area, where the dividend yield would approach 4.5%.
12-month target: $250, which is between the median analyst target of $263 and the current level, representing roughly 19% upside. This target assumes that the backlog conversion materializes and the 22%+ margin target is reached, allowing the stock to re-rate to a 10x forward P/E. The wide analyst spread (low $239, high $293) makes this a medium-confidence number.
Invalidation level: A close below $190 on above-average volume would break the technical support and suggest the decline is not over. That would also push the stock below the level where the dividend yield crosses 4%, which could trigger further selling from yield-oriented holders. If that happens, the bull case must be reassessed – the orders and backlog would need to show deterioration, not just a lag in conversion.
The most honest reading of the signal set is that the fundamental improvement is real but the technical damage is deep, and the stock will need a catalyst – likely the next earnings report on October 22 or a sustained uptick in Process Automation orders – to break the downtrend. Until then, patience and a disciplined entry zone are the right tools. The breakup has already validated management's strategic choice. Now the market needs to validate the price.
Want deeper research on any stock? Try Kavout Pro for AI-powered analysis, smart signals, and more. Already a member? Add credits to run more research.