Okta’s 11% Selloff Exposes a Multiple Problem, Not a Company Breakdown

Key Takeaways
- Okta (OKTA) was down 10.23% at $187.18 in afternoon trading on October 16, despite no new company filing, product warning, downgrade, or earnings release. The stock was about 19% below its October 9 closing high of $232.13 and roughly 20% below its $235 intraday high.
- The business recently beat and raised guidance, but investors were paying about 47.5 times the midpoint of fiscal 2027 adjusted earnings for only 10% to 11% expected revenue growth. That leaves the stock exposed when rates and technology valuations move lower.
- Okta’s proprietary technical picture had already weakened before Friday. Seven of eight monitored technical and flow signals were bearish at Thursday’s close, while the overall composite score remained 70. The immediate question is whether the stock can hold the 50-day average near $179.
The Selloff Had No Okta Catalyst
There was no new Okta filing, advisory, downgrade, or earnings report on October 16. The last quarterly release, on August 26, was a beat-and-raise event that lifted the stock 28.6% in one day. The next report is expected in late November or early December, but no date has been announced.
In afternoon trading, OKTA had fallen $21.34 from Thursday’s close and was trading near the session low. The live quote was $187.18, while the daily record showed a low of $185.12. Volume had reached about 5 million shares, above the roughly 2.1 million to 4.7 million range seen in recent September and October sessions.
The selling occurred during a broad technology and cybersecurity decline. Palo Alto Networks was down 7.8%, CrowdStrike 7.3%, Fortinet 7.9%, Zscaler 7.0%, Cloudflare 7.4%, and SentinelOne 9.6% in the same afternoon snapshot. CIBR and HACK were down about 5%, IGV was also down about 5%, and QQQ was lower by 2.1%.
The sector had identifiable pressure points. Palo Alto Networks was dealing with an actively exploited vulnerability, while concerns were spreading that artificial-intelligence spending could become harder to finance. Okta had no newly disclosed flaw and no new competitor report of its own. Its stock-specific problem was different: it had risen farther than its peers and therefore had more valuation to surrender.
That is a plausible explanation for relative underperformance, not proof that one headline caused the decline. The evidence shows a sector selloff, a large Okta run-up, and a valuation that remained demanding after the stock fell.
A Large Gain Has Become a Fast Reversal
Okta closed 2025 at $86.47. It reached $172.91 on August 27 after the quarterly beat and raise, then climbed to a closing high of $232.13 on October 9. By October 16 afternoon trading, it was at $187.18.
The stock was approximately 19% below the October 9 close and about 20% below the $235 intraday high reached on October 12. The distinction between those two reference points matters: the closing high is the cleanest measure of the prior completed trading level, while the intraday high shows the deeper peak that buyers briefly accepted.
The reversal began before Friday. Okta fell 6.5% on October 14 on 4.65 million shares and declined another 1.6% on October 15. On October 16, it opened at $212, which was also the session high in the daily record, and then moved lower. Through early afternoon the stock kept printing lower lows without a meaningful bounce.
At $187.18, the stock remains more than twice its year-end price. Measured at a somewhat lower afternoon price, the year-to-date gain was roughly 115%. That gain is important context, but it does not establish how current shareholders acquired their shares or whether they are selling. It does show why a valuation reset can be severe even when the company has not issued bad news: investors can reduce exposure after a major run-up without needing a new fundamental disappointment.
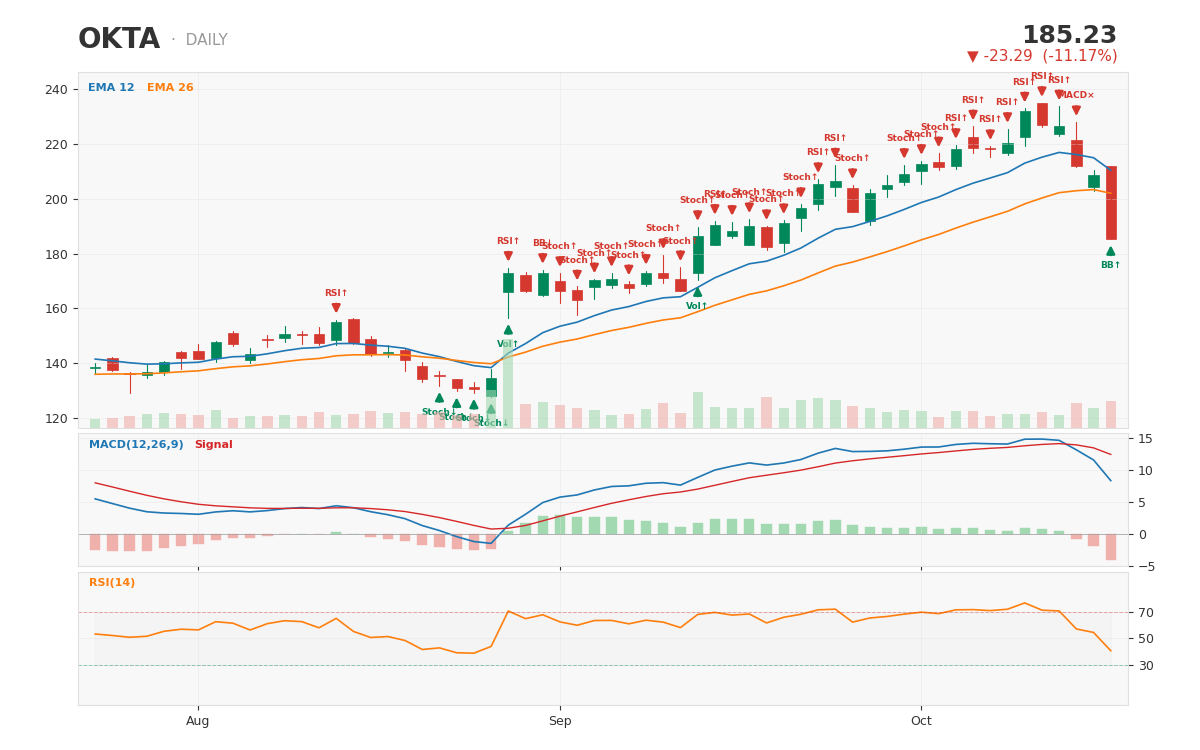 OKTA daily chart with technical signals, generated midday Oct 16 -- the three-session reversal from the Oct 9 closing high of $232.13 toward the 50-day average near $179 after the Aug 27 earnings gap
The Composite Score Stayed Strong as the Trading Picture Broke
The most useful split in the data is between the overall composite and the trading signals. As of Thursday’s close, Okta had a composite score of 70, the highest in the available batch. Its technical rating was 43, its moving-average score was 50, and its oscillator score was 37.
That combination does not say the business was deteriorating. It says the factors supporting the broader score had not prevented the immediate price and flow picture from weakening. The composite score therefore should not be treated as a timing signal.
Before Friday’s decline, the stock was below VWAP and VWAP was falling. The trend-following reading had turned to sell, the Ichimoku framework was bearish, and the accumulation/distribution and on-balance-volume readings were falling. Okta was also underperforming the market. In total, seven of eight monitored signals were bearish at Thursday’s close. The remaining overbought reading was stale relative to the recent break.
The practical conclusion is narrower than “the chart has failed.” Okta had already lost several forms of confirmation before Friday’s larger decline. That made the stock more vulnerable to another day of sector-wide selling.
The 50-day moving average was $179.02, compared with the live price of $187.18. Okta had been about 30% above that average on October 9 and was only about 4.5% above it after Friday’s decline. The 200-day average remained much lower at $118.02. The nearer level is therefore the more relevant test for the current trade, while the longer-term average does not offer an immediate decision point.
The Business Is Healthy, but the Price Requires Continued Execution
The latest results do not show an operating breakdown. Second-quarter revenue was $805 million, up 11%, and subscription revenue increased 12%. Remaining performance obligations rose 17% to $4.858 billion, while current remaining performance obligations increased 14% to $2.585 billion.
Profitability and cash generation were also strong. Non-GAAP operating income was $226 million, a 28% margin. Free cash flow was $227 million, or 28% of revenue, compared with $162 million, or 22%, in the year-ago quarter. GAAP net income was $116 million, up from $67 million. Cash and short-term investments totaled $2.299 billion, while total debt was $53 million after the company settled $350 million of convertible notes in cash.
Management raised fiscal 2027 guidance to revenue of $3.216 billion to $3.226 billion, non-GAAP operating income of $830 million to $840 million, and non-GAAP earnings of $3.90 to $3.94 per share. The midpoint of the operating-income range implies a margin near 26%, compared with 22% in fiscal 2025.
That is the bull case in concrete terms: Okta is converting moderate revenue growth into stronger margins and cash flow, while current contracted revenue is growing faster than total revenue. Chief Executive Todd McKinnon described the strategic opportunity this way: “As AI agents transform every layer of technology, every agent needs a trusted identity and clear controls over what they can access and do.”
The counterpoint is that revenue growth has remained in a 10% to 12% range for five quarters. The re-rating was driven primarily by margin improvement and better cRPO growth, not by a sudden acceleration in the top line. The business can justify a premium if those improvements continue, but the stock is not priced as though merely maintaining the current trajectory will be enough.
Valuation Leaves Little Room for a Rates Shock
At $187.18, Okta trades at roughly 47.5 times the midpoint of its fiscal 2027 non-GAAP earnings guidance. At the October 9 closing high, the comparable figure was about 59 times. The decline has reduced the multiple, but it has not made the stock inexpensive.
The stock also traded at about 32 times free cash flow, with a free-cash-flow yield near 3.1%. Those measures reflect a cash-generative company with net cash, not a distressed one. They also clarify why the valuation can remain sensitive to changes in rates: investors are paying for cash flows, margins, and strategic opportunities that extend beyond the next quarter.
On Friday, the 10-year Treasury yield was 5.10%, the VIX was 21.7 after rising 32%, and QQQ was down 2.1%. Market commentary on the day also cited concern that artificial-intelligence spending could become harder to finance. These facts support a market-wide de-rating interpretation, but they do not isolate the precise cause of Okta’s move.
The stronger conclusion is comparative. A company guiding to 10% to 11% revenue growth and trading at 47.5 times guided earnings needs continued margin expansion and cRPO momentum to defend its price. If rates rise while those operating measures merely hold steady, investors may decide that the multiple should be lower even though the business remains sound.
Insider Sales Add Caution, Not a Business Diagnosis
Insiders sold approximately $27.1 million of shares in the last 45 days, with no purchases. The transactions included CFO Brett Tighe’s sale of 80,000 shares for about $12.9 million and CEO and co-founder Todd McKinnon’s sale of 48,822 shares for about $9.4 million. Other sales came from Eric Kelleher and Chief Accounting Officer Shibu Ninan.
Ninan’s October sales were reported as made under a pre-planned trading arrangement. The available evidence does not establish whether the CEO’s or CFO’s sales were similarly scheduled. That distinction matters: the insider activity can be described as additional supply and a lack of offsetting purchases, but it cannot be treated as evidence that management anticipated an operating problem.
The timing is notable because the reported sale prices ranged from $160.97 to $220. Executives can sell for reasons unrelated to their view of near-term performance, so the insider tape is a cautionary input rather than a forecast.
The latest reported holders included Ken Griffin with 3.4 million shares, Steven Cohen with 2.8 million, and PRIMECAP Management with 1.7 million. The two largest listed holders are associated with multi-strategy or quantitative operations. That makes the ownership data less useful as proof of a stable, low-turnover shareholder base.
Analyst positioning is more favorable. The consensus target was $201.76, the median was $215, and the ratings included 39 buys, 13 holds, and one sell. The target range ran from $60 to $245. The consensus is a reference point, not a catalyst or a reliable floor, particularly after the stock moved from above that target to below it within days.
The Next Report Is a Test of the Multiple
The next company-controlled event is the Q3 fiscal 2027 report, expected in late November or early December, although no date has been announced. The relevant questions are whether revenue remains near the guided $813 million to $817 million range, whether cRPO growth stays around the low double digits, and whether the non-GAAP operating margin remains in the mid-20s.
Those figures matter because they are the bridge between the current valuation and the operating story. Another quarter of roughly 10% revenue growth would not by itself justify a higher multiple. The stock needs that growth to arrive with durable margin expansion, strong cash conversion, and evidence that the large-customer momentum reflected in cRPO is holding.
The bullish argument remains credible. Okta has net cash, high free-cash-flow generation, improving GAAP profitability, and an identity opportunity tied to artificial-intelligence agents. The bearish argument is that those strengths are already reflected in a multiple that remains high after the selloff.
A further increase in guidance or clear stabilization in cRPO could challenge the bearish price action. Conversely, a miss or a loss of margin momentum would make the valuation reset easier to defend. The report is therefore not simply a check on whether Okta is profitable; it is a check on whether the company can keep improving fast enough to support the price investors recently assigned to it.
The Trade Is Conditional on $179 Holding
At $187.18, Okta is close enough to its $179.02 50-day average that a new purchase should not be based on the assumption that a large decline automatically creates value. The more defensible stance is a conditional buy only after the stock stabilizes near that level.
The $179 to $187 area is a reference zone, not guaranteed support. A sustained break below $179, particularly with expanding volume and continued weakness in software shares, would invalidate the near-term setup. A brief intraday breach would be less conclusive, but persistent trade below the average would show that the first nearby support failed.
If Okta holds the area and the next report preserves roughly 10% revenue growth, low-double-digit cRPO growth, and mid-20s operating margins, the selloff would look more like a valuation reset in a financially sound company than the beginning of an operating collapse. A move back toward the $201.76 consensus target is possible, but that target should be treated as a valuation reference rather than a forecast with high confidence.
The stance is therefore cautious and conditional: do not chase the rebound, but do not confuse the price decline with evidence that the business has broken. The key fact to remember is that Okta’s strong fundamentals are now competing with a damaged chart and a still-demanding multiple; a sustained break below $179 would make the chart, rather than the composite score, the stronger evidence.
Want deeper research on any stock? Try Kavout Pro for AI-powered analysis, smart signals, and more. Already a member? Add credits to run more research.