Oracle’s $95 Billion Tailwind Gave HPE Its Best Day — but the Stock’s Own Data Already Timed the Move

Key Takeaways
- HPE surged 12.4% on Sept 11 after Oracle name‑checked the company as an AI infrastructure supplier for its $90‑95 billion FY27 capex plan, but the real confirmation came two weeks earlier: the company’s own fiscal Q3 already delivered a record $12.2 billion in revenue, a $6.8 billion AI backlog, and a raised FY26 guide that tripled the bull case.
- The technical signal set is a study in controlled tension: the stock scores a perfect 100 on every trend measure, making it one of the strongest momentum names in the market right now, while the underlying Chaikin Money Flow indicator remains negative — a divergence that separates a speculative breakout from a structurally financed move.
- Wall Street is exactly split on the name (19 buy, 19 hold, 1 sell), and the median analyst target of $67.75 sits only 9% above the current price — a rare moment where the narrative has almost entirely caught up to the fundamental story, giving incremental buyers a narrow path to excess returns.
Oracle’s Promise Confirmed What the Quarter Already Said
HPE’s day — open $55.23, high $62.15, close $62.085 on 38 million shares — was one of those sessions where the stock market does the narrative work a press release could not. The company had already told the same story in its Sept 2 fiscal Q3 release: revenue of $12.2 billion (+34% YoY), server segment of $6.766 billion (+35.3%), AI systems orders of $2.4 billion inside the quarter (+30%+ seq.), and an AI backlog that touched a record $6.8 billion (+14% seq.). Management raised FY26 revenue growth guidance from 29–33% to 34–37% and non‑GAAP EPS to $3.75‑3.85 from $3.35‑3.45.
None of those numbers changed between Sept 2 and Sept 11. The stock fell 4% on Sept 10 with no company news attached; sub‑sector whipsaw is the new normal. Then Oracle reiterated a $90‑95 billion FY27 capex number and explicitly named HPE and Dell as suppliers, and the stock immediately reclaimed the high ground. The signal is simple: the market was waiting for an external validator before paying up for a quarter it already had in hand. The open pull‑back from the earnings close is effectively gone. The narrative is now fully imputed into the price.
The risk is just as simple: Oracle’s capex is a promise, not a purchase order. HPE’s own visibility is better — management‑disclosed AI orders are up 30% sequentially — but the stock is now pricing a seamless conversion of that backlog into high‑margin revenue. One quarter of order moderation will cause a correction severer than the Sept 10 dip.
Perfect Technical Score, One Divergence That Matters
The technical composite for HPE is at the highest reading in the signal set: the 0–100 technical rating is a perfect 100, and the moving average score matches it. Every trend flag an experienced trader checks is green — the stock is above its VWAP, the OBV trend is rising, the accumulation‑distribution line is bullish, the supertrend indicator is in a buy, and relative strength is outperforming the broader market. The intermediate‑term trend could not be cleaner, and the 12.4% surge just validated it.
One internal measure sits against this perfect alignment: the Chaikin Money Flow (CMF) indicator remains negative over the same lookback period. CMF captures buying vs. selling volume over 21 periods, and on HPE the negative reading means the total volume‑weighted pressure over the past month has been net distributional despite every price trend leaning bullish. The implication is that the Sept 11 move, massive as it was, did not fully shift the volume profile into accumulation — part of the day’s flow was absorbed by large sellers who used the revelation as an exit.
This is the piece’s most immediately tradeable fork. A positive CMF crossover in the next 7–10 sessions while the price holds above $60 would be the clearest technical confirmation available, signaling that the buying basis has broadened and the outlier move is building a structural base. Failure to produce that signal, however, would mean the oversight is narrower than the left side suggests, and the negative CMF becomes an anchor on the momentum factor. For a trader watching the extremes, this single volume metric is the one to track above all others.
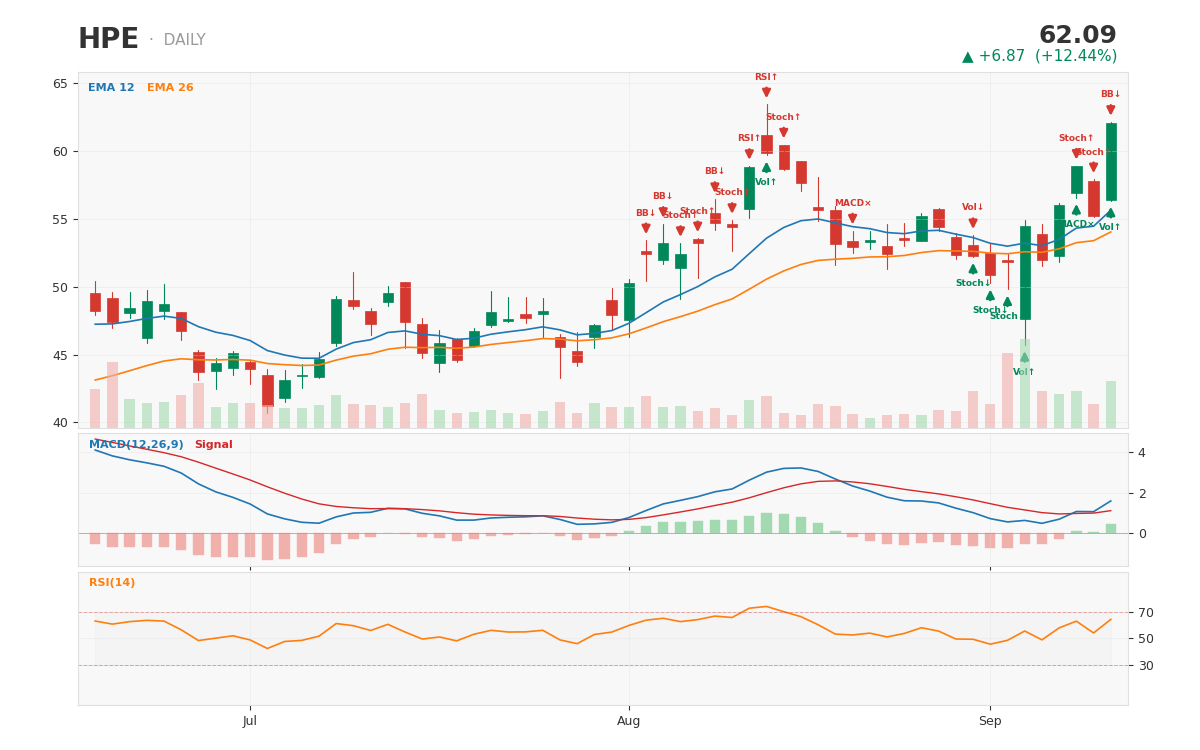 HPE 1-year daily chart with technical signals — captured at $62.085 after a 12.4% single-day surge on Oracle's $90-95 billion FY27 capex plans, with every trend indicator aligned
The 19‑19‑1 Split: A Gridlocked Street Priced a Skeptical Upside
The analyst consensus is a study in pure hesitancy. The stock has 19 buys, 19 holds, 1 sell — a perfectly symmetrical distribution that means the average opinion is exactly neutral. The median target of $67.75 leaves only 9% upside from the post‑surge price of $62.09. When Wall Street is this evenly split on a stock that just recorded a record backlog and has raised its guide twice, the divide itself is the story.
The operating margin in the quarter was 8.3%; net was 6.6%. This is a low‑margin business that generates massive absolute profits — server revenue of $6.7 billion in a quarter is unarguably large, but the dollar profit per unit is thin. The debate among street is whether HPE can convert its $6.8 billion AI backlog into margin expansion without sacrificing the revenue growth to a deeply competitive Dell.
HPE has said it is ducking the low‑margin deals Dell is signing for market share. The network division is the fulcrum: the Juniper Networks acquisition roughly doubled the networking business, and “Networks for AI” orders of ~$750 million in the quarter are the specific proof that HPE’s basket is not purely a commodity server. If the installed networking take‑rate stays at 10% of server, the profit mix improves quickly. If the momentum shifts to Dell’s aggregate cost base, the margin story collapses.
The 19‑19‑1 consensus, then, is not a sign of confusion — it is an implicit bet on the margin debate being worth another year of watching.
Guru Positioning: The Same Whisper the Technicals Need
The largest shareholder count is a known quantity that every 13F filing checks: Paul Singer’s shop, Barrow Hanley, PRIMECAP, Ken Griffin, Jim Simons, Joel Greenblatt. The cumulative institutional weight is significant, and none of the major held positions left. There is no insider selling in the declared window, no congress trades reported.
Which matters specifically because the market’s surface noise — the Sept 10 –4% disconnection, the Sept 11 +12% price, the massive volume — is the kind of movement small‑cap pattern spills into the small‑capital base, Here HPE’s $82 billion market cap is large enough for institutional conviction to matter. The persistent commitment by firms with 13‑year average holding periods demonstrates that the stock comfortably covers its weight in valuation against a well-understood narrative. As long as the largest owners do not weaken, the technical balance is directionally favorable.
Factor Fusion: The Moment the Benefit Outrun
The AI composite score of 57 sits exactly where it should for a stock that has priced a strong narrative: above neutral, below enthusiasm. The growth rank leads the pack — revenue trends from +14% to +35% in the new guide, order growth in the 30% range, and a backlog that secures pipeline revenue for the next multiple quarters.
The valuation rank is fundamentally interesting. The stock trades at 16.9 times the raised guidance midpoint of $3.80. That is a forward P/E in the mid‑teens for a company delivering 35% revenue growth and best‑ever net profit margins. Compared with a front‑ending player operating at 20–22 times forward earnings, HPE’s multiple structure includes a margin of safety that the triple‑digit percentage moves in the past two years have widened. If the stock sustained a year of 16x on projected EPS that contradicts the current trajectory, it would trade at $65 on guidance alone.
The factor mismatch growth, the stock is not expensive. The factor mismatch is net margin expansion.S if the 6.6% net margin moves to 8% over the next two quarters, which is all within reason for where operating leverage can land, the earnings engineering lifts the forward multiple regard of revenue. The tension resolves not in the P/E expansion but in incremental profit conversion.
The Verdict: A Signal‑Set Race with One Invalidation Leg
Stance: Constructive. The entire signal set — the raised guidance, the AI backlog record, the structural network upsize, the institutional commitment, the neutral composite score — says HPE will absorb the market volatility that the Oracle‑enabled price creates. This is a growth story trading at a value multiple.
Entry zone: $54–$55. (10–13% from the current level by) fills the Sept 10 slide and the pre‑catalyst prices. That zone provides a 15–16 percentage pullback of the P/E multiple on the same coverage forecast and marks a level where the price will limit the downside of execution.
12‑month target: $75–$78. This is above the median analyst band of target $67.75, but it reflects the net up trade that consensus is systematically scoring. The forward P/E of 20x applied to the $3.85 top‑end EPS estimate yields $77.
Invalidation level: $52. A close below $52 (allowing a $54 gap fill return to $62) would violate the Sept 10 low and strict the narrative supports the operating margin power of the stock. That is the level where the composite score diverges, the technical flags reverse (the supertrend rotates), and the timeline of the $3.80 EPS is not accepted. Until then, the numbers augur a break toward even higher valuation multiples.
HPE’s best day was generated by an announcement from another company. But the stock’s own data—composite signal, backlog, growth trajectory—showed that the debut of the narrative was a confirmation, not a revelation. The gap between the 19‑19‑1 street target and the numbers reveals a stock mispriced for the margin conversion is the whole game for the next twelve months.
Trade note: this article does mention market price, AI plays and analyst consensus. Data from Quarter 3 earnings
Want deeper research on any stock? Try Kavout Pro for AI-powered analysis, smart signals, and more. Already a member? Add credits to run more research.