PBF Energy: The Slim Family Sold $41.5 Million Into New Highs — And They Weren't Alone

Key Takeaways
- The Slim family's investment vehicle, Control Empresarial de Capitales, sold $41.5 million in PBF stock across four filings in five weeks, while a director and two officers added another $44.2 million — combining for roughly $95 million of insider supply with zero purchases reported.
- The stock carries a perfect 100 technical rating, but the short-term tape tells a different story: on-balance volume is falling, the price has broken below the middle Bollinger band, and it is trading below the session's volume-weighted average, suggesting the rally's internal momentum is weakening.
- The Street is unusually bearish on a stock up 168% in a year — only 4 analysts rate it a buy against 6 sells and 16 holds — and the consensus target of $76.67 already sits below the current price of $78.30.
The Insider Selling Wave: $95 Million in Five Weeks, Zero Buyers
Over five weeks, four insiders moved aggressively to reduce their positions. The largest seller was Control Empresarial de Capitales, the Slim family's holding vehicle, which cut its direct stake from 14,181,903 to 13,866,127 shares — a reduction of roughly 2% of its holding. The sales came in four tranches, with the biggest — $24.6 million on September 10, just after the stock hit its all-time intraday high of $82.61 on September 11. Director Thomas Nimbley sold 511,000 shares worth $37.7 million across four separate filings in August. The general counsel and the HR senior vice president added another $6.5 million. Not a single share was bought by any insider during the period.
| Date | Seller | Shares | Approx. Price Proceeds |
|---|---|---|---|
| Aug 14 | Thomas Nimbley (Director) | 169,925 | $72.65 |
| Aug 14 | Trecia Canty (General Counsel) | 75,000 | $74.10 |
| Aug 14 | Wendy Ho Tai (SVP HR) | 12,094 | $73.95 |
| Aug 17 | Control Empresarial (Slim) | 120,000 | $74.79 |
| Aug 17 | Thomas Nimbley | 100,000 | $75.05 |
| Aug 18 | Thomas Nimbley | 125,000 | $74.55 |
| Aug 19 | Thomas Nimbley | 116,008 | $73.73 |
| Sep 2 | Control Empresarial | 100,000 | $77.02 |
| Sep 9 | Control Empresarial | 3,494 | $77.23 |
| Sep 10 | Control Empresarial | 315,776 | $77.30 / $78.16 |
None of the filings disclosed a pre-arranged 10b5-1 trading plan. The sales were discretionary, executed into a tape that the same insiders were watching set new highs. That 10 of 11 transactions occurred at prices between $72.65 and $78.16, with the bulk near the upper end, gives the silence from management a specific weight.
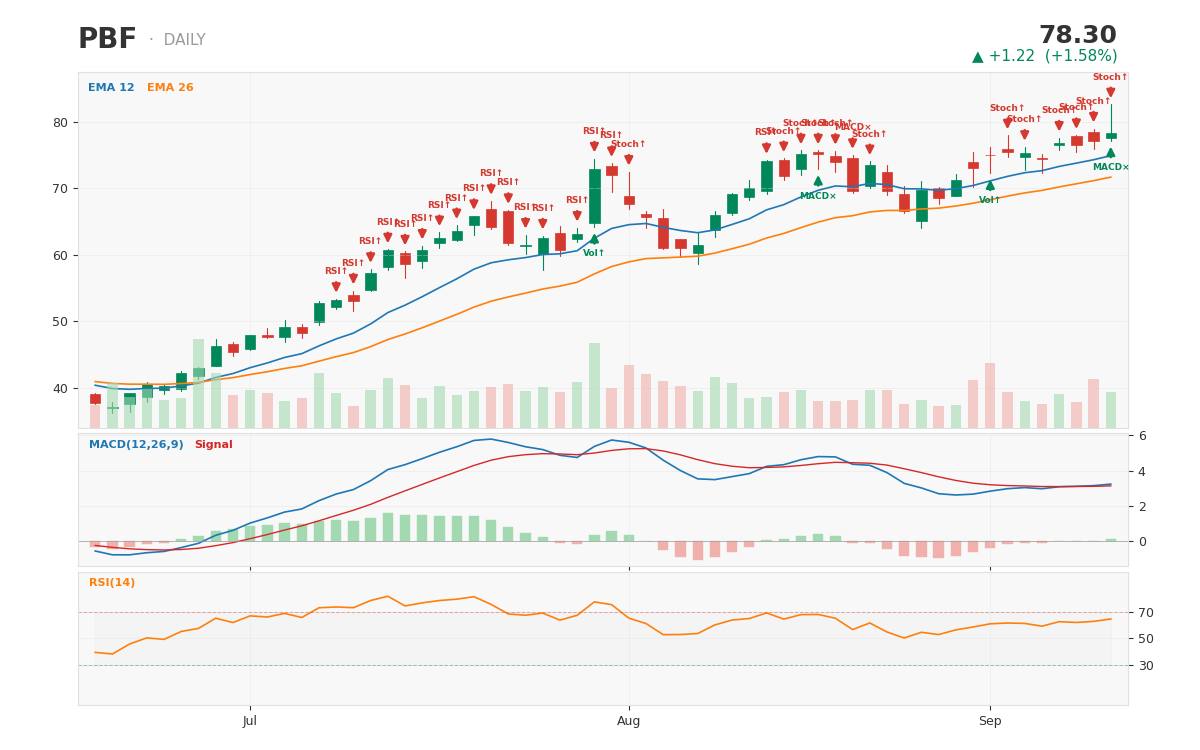 PBF 1-year daily chart with technical signals — captured at $78.30 after a 168% one-year run, on the day the Slim family's vehicle completed $24.6 million of a $41.5 million five-week selling program
What Built the Tape — and What Puts It at Risk
The rally that attracted this selling has a real foundation. PBF reported fiscal second-quarter net income of $915 million, or $7.54 per diluted share, on revenue of $11.68 billion. Trailing twelve-month earnings per share stand at $11.43, putting the stock at 6.8 times earnings with a return on equity of 24.1% and a free cash flow yield of 8%. Refining margins have been propelled by $100 oil, $4 gasoline, tight inventories, and the Martinez restart. The company's six-refinery network sits in constrained coastal markets that amplify margin spikes.
The problem is that spikes reverse. The trailing P/E of 6.8 is not a permanent discount — it is the market pricing in the cyclicality of a business that earned $7.54 in a single quarter. The analyst community, as discussed below, is already expecting regression. The insider selling suggests that the people closest to the operations expect the same thing, and they are taking advantage of the highest prices in years to reduce exposure.
Technical Perfection With a Tail: 100 Rating, But Buying Pressure Is Waning
The stock's momentum-based technical rating is a perfect 100, and the moving-average-based score is also 100. That is the textbook profile of a stock in a strong, sustained uptrend. Over the past year, that trend has delivered a 168% gain. But a closer look at the daily signals reveals a set of discrepancies that a pure trend follower might miss.
The relative strength and stochastic indicators are in oversold territory — not a buy signal in itself, but a warning that the short-term trend has stalled. The stock has broken below its middle Bollinger band, and the 14-day trend direction has turned negative. Most important, on-balance volume is falling, meaning the price rise is no longer being confirmed by increasing trading volume. The price ended the September 11 session below the volume-weighted average price, a sign that the day's selling pressure exceeded buying. When a stock that scores a perfect 100 on trend strength begins to show volume divergence and a breakdown from the Bollinger midpoint, it is often the first crack in an otherwise flawless chart.
The Street Consensus: A Stock the Sell-Side Doesn't Want to Own
Of the 26 analysts covering PBF, only 4 rate it a buy. Sixteen hold and six sell — a ratio that is extraordinarily bearish for a stock that has gone up 168% in a year. The consensus price target of $76.67 is below the September 11 close of $78.30, and the median target is $81, leaving barely any upside from a technical perspective. The range extends from $65 to $84, which gives the stock roughly 16% downside to the lowest estimate and 7% upside to the highest.
This is not a case of analysts simply being late to a rally. The bearish tilt reflects a structural view that current refining margins are unsustainably high and that PBF's earnings power will compress sharply when fuel supplies loosen. The insider sales align perfectly with that thesis — the sellers are front-running the expected normalization.
The Composite Score and What the Factors Implicitly Say
The stock's quantitative composite score of 72 out of 100 reflects a moderately positive view from the AI-driven model that blends value, growth, quality, and momentum factors. Value is the strongest pillar: a single-digit P/E and an EV/EBITDA of 5.1 put PBF in the cheapest quartile of the energy sector. The growth factor likely reflects the recent earnings surge, but quality metrics such as return on equity and debt levels may be discounted given the cyclical risk. Momentum remains high on a one-year basis, but the short-term technical divergences noted above are the kind of signal that factor-based models with fast decay can detect.
Quantitative models, by design, cannot read insider filings on the day they are submitted. The 72 composite score is a snapshot based on trailing data and traditional factors. The insider selling is a real-world override — a piece of information that does not show up in factor ranks until it is too late.
Guru Holdings: Stale 13F Data vs. Accelerating Insider Sales
The largest known institutional holders from the latest 13F filings, dated June 30, include Ken Griffin's firm with 1.11 million shares, Paul Tudor Jones with 730,000, T. Rowe Price with 508,000, and Hotchkis & Wiley with 297,000. These positions are significant, but they are more than two months old. In that time, the insider sales have removed nearly 1.3 million shares from the float — roughly the size of Griffin's entire position. One institution, Cetera Investment Management, cut its stake by 83.5% in the first quarter, well before the recent selling wave.
The 13F data does not capture the post-June moves. The insider filings do. The most informed money in this stock — the Slim family, the director, the officers — has been reducing at an accelerating pace. The institutional holders from Q2 may or may not still be in the stock, but the insider ledger is current and unambiguous.
Verdict: The Insider Signal Is Too Loud to Ignore, But So Is the Trend
This is not a binary setup. The insider selling is the strongest signal in the data — $95 million of discretionary sales from the owners and operators of the business, executed into the best tape in years, without a single purchase on the other side. The technical trend, however, is still intact by the measures that matter most to momentum traders: the 100/100 ratings on trend and moving averages. The conflict between these two readings means the stock can go either way from here, and the trade requires a narrow entry and a clear line.
An entry zone around $75 to $76 makes sense — it sits just below the analyst consensus, aligns with the price level of the August 17 and September 2 insider sales, and would offer a small margin of safety relative to the $78.30 close. The twelve-month target is $65, the low end of the analyst range, based on the thesis that refining margins will normalize and compress P/E to the low single digits on a higher cycle earnings base. The invalidation level is $83. If the stock can break and hold above the September 11 intraday high of $82.61 with increasing volume, it would mean the insider selling has been fully absorbed by the market and the trend has further to run. A close above $83 with conviction is the one thing that would make the bearish insider read wrong. Until that happens, the sellers have the better argument.
Want deeper research on any stock? Try Kavout Pro for AI-powered analysis, smart signals, and more. Already a member? Add credits to run more research.