We began this blog series by talking about price and breadth momentum. In this article, we continue the discussion with risk-adjusted momentum. This takes into account the level of risk involved with a given equity. By taking into account volatility, we are able to mitigate the momentum factor from suffering from swift changes in market direction.
Risk-adjusted momentum looks at three variations:
- 50 rolling days of standard deviation
- 100 rolling days of standard deviation, and
- 200 rolling days of standard deviation
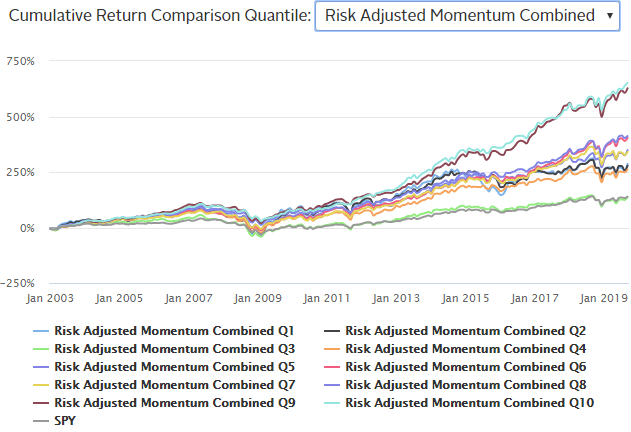
For the sake of illustration, the below graph is the combined risk-adjusted momentum of all three variations. Portfolio Q10 performed the best with a cumulative return of 651.32%. What does Portfolio Q10 mean?
How did we back test?
To demonstrate the performance of each momentum factor, we chose the largest 500 US equities by market capitalization, and then ranked them by its momentum factor. The universe was then divided into 10 quantiles of stocks. The top quantile (Q10) represents the stocks with the highest value for that given momentum factor, while the bottom quantile (Q1) represents the stocks with the lowest values of that momentum factor. The portfolios are rebalanced monthly and use a market-cap weighted method.
Winning and losing stocks ranked by risk-adjusted momentum factors can be downloaded for free. Head over to the Sample Data section, register for free and start downloading.
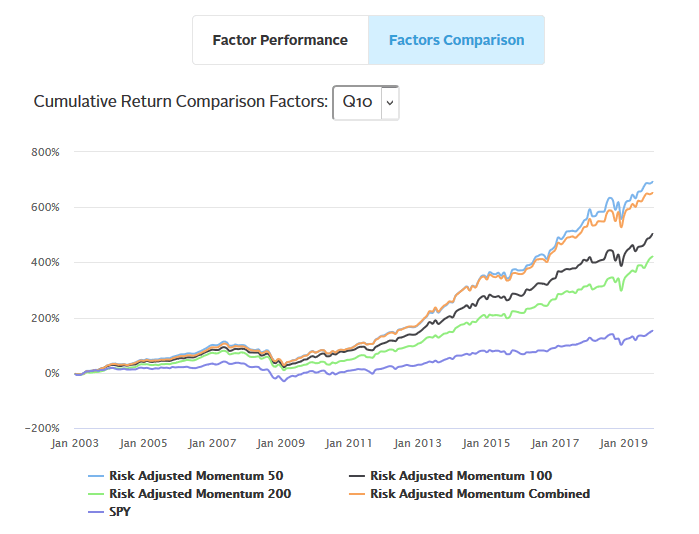
In looking closer at portfolio Q10, we notice that risk-adjusted momentum adjusted by the 50 rolling days of standard deviation had the best performance of 686.16%.
To get to this view, under Overview / Performance Overview section, select Factors Comparison tab on the top, then select Q10 from the Drop Down window.
Interested in knowing which stocks are ranked the highest by the various momentum factors automatically, read our blogs on price and breadth momentum, trend momentum and idiosyncratic momentum.
A full library of stock rankings by factors and signals, both current and historical, are available at our factor library.