


Forex News•1 week ago
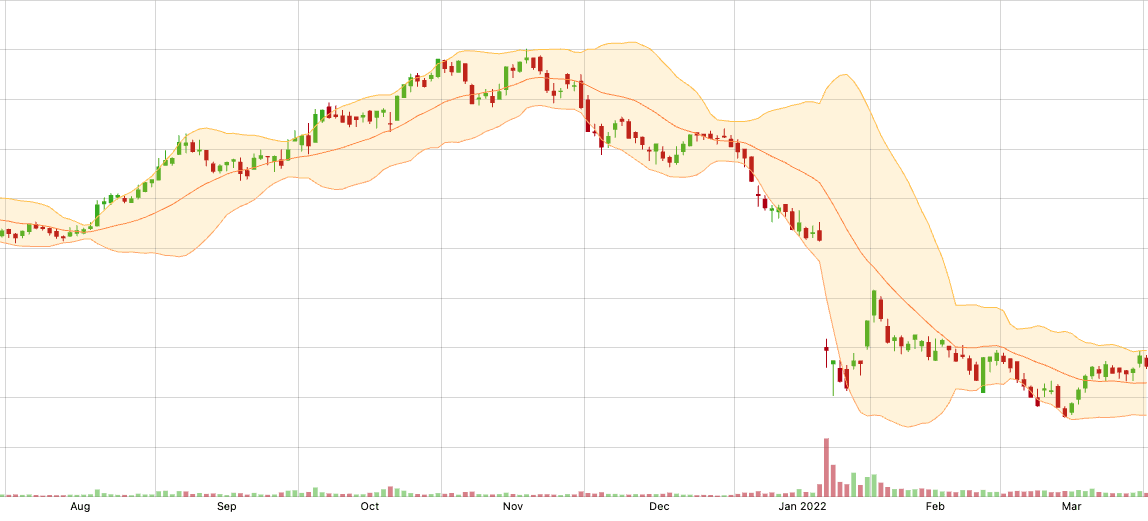
NZDCAD Wave Analysis
NZDCAD reversed down from the 0.8260 resistance zone and upper daily Bollinger Band, a level that has repelled price since last September.
How three simple lines can transform your trading game and help you read market emotions like a pro
Picture this: You're staring at a chart, watching price bounce around like a pinball, wondering when to enter or exit your trade. Sound familiar? Every trader has been there. The good news? There's a tool that can help you make sense of this chaos, and it's been hiding in plain sight on your trading platform.
Meet Bollinger Bands—three deceptively simple lines that have been quietly revolutionizing how traders understand market volatility since the 1980s. Created by John Bollinger (yes, that's his real name), these bands aren't just another technical indicator collecting dust in your toolkit. They're your window into the market's emotional state.
Think of Bollinger Bands as a dynamic envelope around price action. Unlike static support and resistance lines that never change, these bands breathe with the market—expanding when things get crazy and contracting when traders are taking a coffee break.
Here's the simple breakdown:
The Three Components:
The magic number "2" isn't random—it's statistically chosen to capture about 90-95% of price action within the bands. When price ventures outside, something interesting is happening.
The distance between the upper and lower bands tells a story. Wide bands scream "volatility!" while narrow bands whisper "calm before the storm."
When Bands Widen:
When Bands Contract (The "Squeeze"):
I learned this the hard way during my early trading days. I kept getting whipsawed in tight markets until I realized those contracting bands were basically the market's way of saying, "Get ready—something big is coming."
Best for: Sideways, choppy markets
This is your bread-and-butter strategy for range-bound conditions. The idea is simple—buy near the lower band, sell near the upper band, targeting the middle line.
Entry Logic:
Reality Check: Don't just blindly buy every touch. I've seen traders get demolished trying to catch falling knives. Always look for confirmation—maybe an oversold RSI reading or a bullish reversal candle.
Best for: Low volatility periods followed by breakouts
This is where Bollinger Bands really shine. When the bands squeeze tight like a coiled spring, you know explosive movement is coming. The question isn't if—it's when and which direction.
The Process:
Pro Tip: Volume is your best friend here. A breakout on heavy volume is like the market shouting its intentions. A breakout on light volume? That's probably just noise.
Best for: Strong trending markets
Here's where beginners often get confused. In powerful trends, price doesn't bounce off the bands—it walks along them like a tightrope walker. This isn't a reversal signal; it's a confirmation that the trend has serious momentum.
In an Uptrend:
In a Downtrend:
| Market Condition | Best Strategy | Key Signals | Risk Level |
|---|---|---|---|
| Range-bound, low ADX | Bollinger Bounce | Band touches with RSI confirmation | Medium |
| After squeeze, high volume | Squeeze Breakout | Decisive close outside bands | High |
| Strong trend, high ADX | Walking the Bands | Consistent band contact | Low-Medium |
Bollinger Bands alone are like a sports car with one wheel—powerful but incomplete. Here's how to add the other wheels:
When price hits the lower band AND RSI shows oversold (below 30), you've got a double confirmation for a potential bounce. Even better? Look for divergence—price making lower lows while RSI makes higher lows. That's often a reversal goldmine.
Volume doesn't lie. A squeeze breakout with massive volume is like the market screaming its direction. Without volume? Treat it like a whisper—interesting but not actionable.
Use MACD to confirm momentum direction. If price breaks above the upper band and MACD shows strong bullish momentum, you might have a "walking the bands" scenario rather than an immediate reversal.
John Bollinger created two additional tools that most traders ignore:
This normalizes where price sits within the bands:
This quantifies how wide the bands are:
Quick Example: In Bitcoin, a BandWidth below 5% often signals a squeeze, while above 15% indicates extreme volatility. These thresholds vary by asset, so backtest your favorites.
Currency pairs love Bollinger Bands because forex markets alternate between trending and ranging. Major news events often create perfect squeeze-breakout scenarios. EUR/USD during ECB announcements? That's squeeze-breakout heaven.
Cryptocurrency volatility can be insane, so consider wider standard deviations (2.5 or 3 instead of 2). The squeeze-breakout strategy works particularly well here because crypto markets often consolidate before explosive moves.
Individual stocks offer great opportunities for W-bottom and M-top patterns using Bollinger Bands. Earnings season creates natural squeeze conditions as uncertainty builds before results.
Plot two sets of bands—one at 1 standard deviation and another at 2. This creates zones:
Combine Bollinger Bands with Keltner Channels. When Bollinger Bands move inside Keltner Channels, you've got an ultra-tight squeeze. When they expand back outside, the breakout often has serious power.
Don't just enter on any band interaction. Wait for volume confirmation. A lower band touch with increasing volume on the bounce is far more reliable than one on declining volume.
Position Sizing Based on Volatility: When bands are wide (high volatility), use smaller position sizes. When bands are narrow, you can afford slightly larger positions since potential adverse moves are typically smaller.
Stop-Loss Placement:
The 2% Rule with BB Twist: Never risk more than 2% of your account on any trade, but adjust your position size based on BandWidth. High BandWidth = smaller positions, low BandWidth = potentially larger positions (within your risk limits).
The creator himself laid out 22 rules, but here are the absolute must-knows:
Here's a systematic approach I've developed over years of trial and error:
Step 1: Market Assessment
Step 2: Strategy Selection
Step 3: Entry Confirmation
Step 4: Risk Management
Bollinger Bands aren't magic—they're a sophisticated tool for reading market psychology. They show you when markets are excited, bored, confused, or confident. But like any tool, they're only as good as the person using them.
The key is understanding that these three lines represent something profound: the market's emotional state made visible. Wide bands reveal fear and greed in full swing. Narrow bands show uncertainty and building pressure. Price interaction with the bands tells you whether that emotion is sustainable or about to shift.
Start simple. Master the basic bounce and breakout strategies in different market conditions. Add confirmation indicators gradually. Most importantly, backtest everything on your favorite trading instruments before risking real money.
Remember, successful trading isn't about finding the perfect indicator—it's about understanding market dynamics and managing risk. Bollinger Bands just happen to be one of the best tools for both.
The market will always surprise you, but with Bollinger Bands in your toolkit, at least you'll have a better sense of when those surprises might be coming.
Want to dive deeper into technical analysis? Follow me for more practical trading insights that actually work in real markets. And remember—paper trade first, profit later.
Explore more signals and indicators like OBV at Kavout Smart Signals