If you're serious about improving your trading—whether in stocks, crypto, or forex—you know price action isn't the whole story. Volume tells you who's truly behind a move. Enter the Chaikin Money Flow (CMF): a unique indicator that fuses price and volume to help you spot when "smart money" is quietly accumulating or dumping an asset. If you want to get ahead of big trends—or just avoid false breakouts—understanding CMF is a must.
What Is Chaikin Money Flow (CMF)?
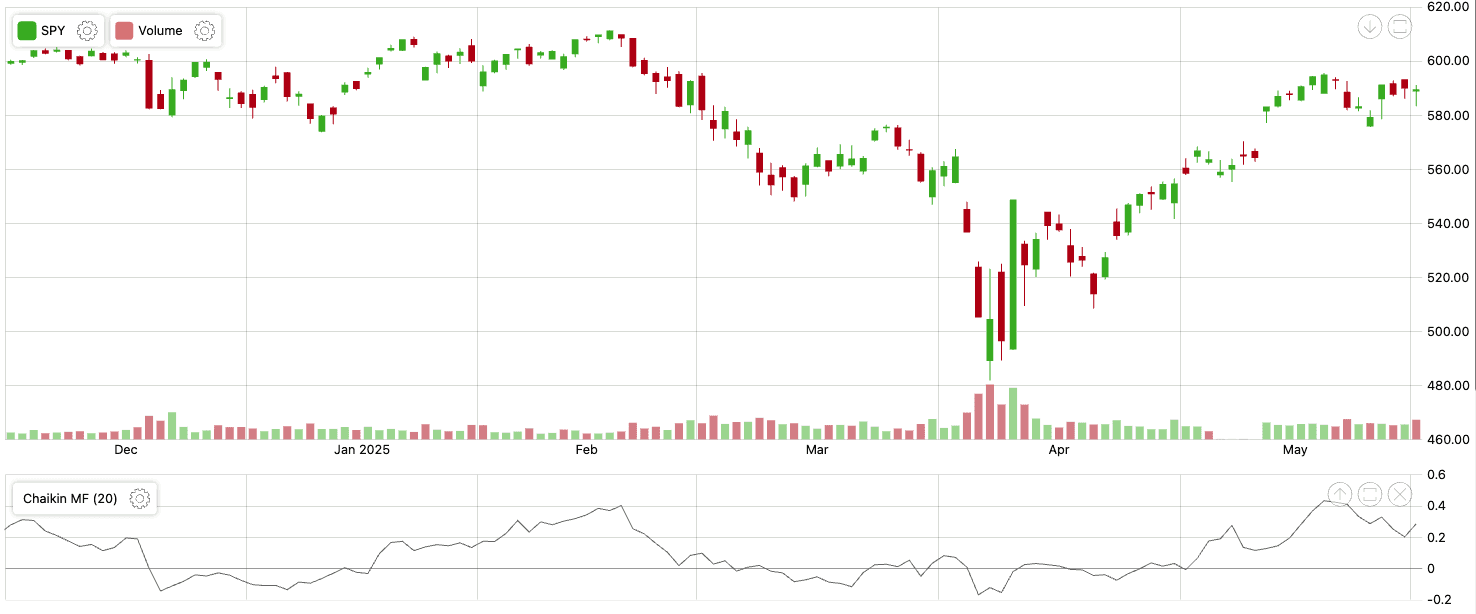
Developed by legendary analyst Marc Chaikin, the CMF is an oscillator that measures buying and selling pressure over a set period (usually 20 or 21 bars). Unlike price-only indicators, CMF actually weighs where price closes within each bar's range and multiplies this by volume, painting a much fuller picture of market conviction.
- CMF above zero: Money is flowing into the asset (accumulation, bullish)
- CMF below zero: Money is flowing out (distribution, bearish)
- Closer to zero: Buyers and sellers are battling; there's no clear winner
The further CMF is from zero (in either direction), the stronger the buying or selling pressure.
How Is CMF Calculated? (Plain English)
Don't get lost in the math—here's how CMF works:
-
For each bar: The indicator checks if the close was near the high (bullish) or low (bearish) of the range, using a simple formula to create a score between -1 and +1.
-
It multiplies this score by volume: A strong close on high volume means more "money flow."
-
Over a set number of periods: It adds up all those money flow values and divides by total volume.
The result is a line that oscillates above and below zero—showing you the net effect of buyers vs. sellers over your chosen window.
1. It's Volume-Weighted
Price-only indicators can be fooled by thin markets. CMF weeds out fake moves by focusing on volume-backed action. A breakout on low volume? CMF will often stay flat or negative, warning you not to chase.
2. It Spots Accumulation/Distribution
Sustained positive CMF readings signal accumulation—even if the price action looks boring on the surface. Negative readings can mean big money is selling into strength. This is especially useful for identifying when institutions are quietly taking positions before a major move.
3. It's Universal
Whether you're trading Apple, Bitcoin, or EUR/USD, the logic behind CMF holds up. It adapts to any liquid market and any timeframe.
Reading the Signals: Interpreting CMF in Real Trading
Above Zero? Below Zero? Here's What Matters
- Consistently above zero: Bulls are in control. Long trades are favored.
- Consistently below zero: Bears have the edge. Look for short opportunities or stay out.
- Hovering near zero: Indecision or chop—proceed with caution.
The further the line is from zero, the stronger the bias. For example, a CMF of +0.30 signals robust buying, while -0.30 shouts heavy selling.
Thresholds Filter Out the Noise
CMF can whip back and forth around zero in sideways markets. Many traders use buffers (like +0.05 and -0.05) to ignore weak signals. Only act when CMF moves decisively beyond these levels.
"Persistence" Is Powerful
If CMF stays above or below zero for weeks or months, it often signals institutional players building or unloading positions—sometimes well before the price itself tips its hand.
Trading With CMF: Proven Strategies
1. Confirming Trends
- Uptrend: CMF stays positive and ideally rises as price rises. This means real buying is supporting the rally—not just speculative noise.
- Downtrend: CMF remains negative and falls as price declines. This signals genuine selling pressure.
- Breakout Validation: If price breaks a major resistance and CMF jumps positive (especially with volume), the breakout is far more likely to stick.
2. Generating Buy and Sell Signals
- Bullish Crossover: When CMF crosses from below zero to above (and preferably over +0.05), buyers are taking over. Consider going long.
- Bearish Crossover: A drop from above zero to below (under -0.05) suggests sellers are in control. Consider shorts or selling existing longs.
- Don't get faked out: Wait for confirmation beyond your chosen threshold to avoid "whipsaw" signals in choppy conditions.
3. Divergence: The Early Warning System
- Bullish Divergence: Price makes new lows, but CMF forms higher lows. This means selling pressure is drying up—watch for a reversal.
- Bearish Divergence: Price makes new highs, but CMF doesn't confirm and makes lower highs. Weak buying pressure = reversal risk.
- Tip: Divergence is especially meaningful if CMF is already near an extreme.
4. Combining CMF with Other Indicators
- With Moving Averages: Only act on CMF buy signals if price is above a long-term moving average; act on sells if below. This filters out trades that go against the prevailing trend.
- With RSI or MACD: Look for confirmation—if both CMF and your favorite momentum indicator flash bullish, conviction is higher. If they disagree, stay patient or reduce position size.
Optimizing CMF: Settings and Timeframes
- Default period: 20 or 21 is most common; use shorter periods for more sensitive, frequent signals (but more noise), and longer periods for smoother, more reliable trends.
- Stocks: Works well on daily and weekly charts to spot accumulation/distribution phases.
- Crypto: Pair with 4H or daily charts to catch big moves supported by real volume.
- Forex: Apply on active pairs and during major sessions for best results.
Test different periods for your asset and timeframe—no single setting fits every market.
CMF in Action: Real-World Scenarios
| Scenario | CMF Behavior | What It Means for Traders |
|---|
| Price breaks out, CMF positive | Volume-backed breakout | Buy and ride the trend |
| Price makes new high, CMF lags | Bearish divergence | Watch for a possible reversal |
| CMF stays negative, price flat | Underlying distribution | Avoid longs—sellers in control |
| CMF flips above +0.05, uptrend | Confirmed accumulation | Look for buying opportunities |
| CMF stuck near zero, price range | No conviction | Sideways—reduce trade size or skip |
Limitations & Pitfalls: What Every Trader Should Know
- Lagging nature: CMF responds to completed price bars and historical volume. You won't catch every top or bottom.
- Whipsaws: In sideways or thin markets, CMF can flip repeatedly. Use thresholds and confirmation from other tools.
- Not great for illiquid assets: Low-volume securities can give unreliable readings.
- Calculation quirks: CMF sometimes gives odd signals during large price gaps or on the entry/exit of very high-volume days. Don't trade on CMF alone.
- Not a standalone system: Always combine CMF with sound risk management and at least one other indicator for confirmation.
Conclusion: The CMF Advantage
Chaikin Money Flow gives you a behind-the-scenes look at what's really happening beneath price action. By blending price and volume, it helps you distinguish genuine trends from head-fakes, spot accumulation/distribution before everyone else, and validate breakouts with conviction.
To get the most from CMF:
- Combine it with trend-following or momentum tools for higher probability setups.
- Use thresholds to avoid getting chopped up by noise.
- Focus on persistent CMF trends—they often signal smart money's next move.
Above all, make CMF part of a disciplined, rules-based approach—not a magic bullet. When used wisely, it can be the difference between following the herd and trading with the institutions.
Ready to see what's flowing under the surface? Add Chaikin Money Flow to your charts and start trading with a volume-powered edge today.
Explore more signals and indicators like OBV at Kavout Smart Signals