Stock Analysis Examples:
SOFI stock analysis PLTR stock analysis AI stock analysis
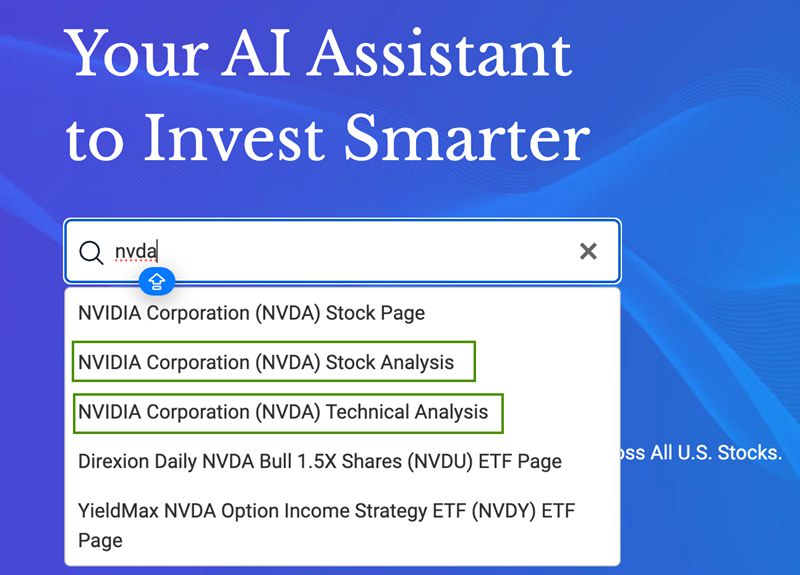
Technical Analysis (for both stocks and ETFs):
XLK technical analysis BABA technical analysis DIA technical analysis
Fundamental Analysis
Fundamental analysis is a method of measuring a company’s intrinsic value by examining related economic and financial factors. Financial statements, which include the income statement, balance sheet, and cash flow statement, are the bedrock of fundamental analysis. They provide a snapshot of a company’s financial health and help investors understand its revenue, expenses, assets, liabilities, and cash flows.
Income Statement Analysis
The income statement offers a view of the company’s profitability over a specific period. Key metrics include revenue, gross profit, operating income, and net income. Revenue growth is a sign of a company’s ability to increase sales and market share. Gross profit margin, calculated as gross profit divided by revenue, indicates how efficiently a company produces goods or services. Operating income reflects the company’s earnings from its core business activities. Lastly, net income shows the company’s total profit after all expenses and taxes have been paid.
Balance Sheet Analysis
The balance sheet provides a snapshot of a company’s financial position at a specific point in time. It lists assets, liabilities, and shareholders’ equity. Assets are resources that a company owns or controls, liabilities are obligations the company owes, and shareholders’ equity represents the owners’ claims after liabilities have been settled. A strong balance sheet typically has a good balance of assets to liabilities and a solid equity base.
Cash Flow Statement Analysis
The cash flow statement reveals the company’s cash inflows and outflows over a period. It is divided into three parts: operating, investing, and financing activities. Positive cash flow from operating activities indicates that the company is generating sufficient cash from its core business operations. Cash flows from investing activities provide insights into the company’s capital expenditures and investments. Cash flows from financing activities show how the company raises capital and returns it to shareholders.
Technical Analysis
Technical analysis uses various statistical indicators to predict price movements based on historical market data. Some of the key indicators include moving averages, the Relative Strength Index (RSI), On-Balance Volume (OBV), and the Chaikin Money Flow (CMF).
Moving Averages
Moving averages smooth out price data to identify trends. The most common are the simple moving average (SMA) and the exponential moving average (EMA). A rising moving average indicates an uptrend, while a declining moving average signals a downtrend. Crossovers between short-term and long-term moving averages can signal potential buy or sell opportunities.
Relative Strength Index (RSI)
The RSI is a momentum oscillator that measures the speed and change of price movements. It ranges from 0 to 100 and is typically used to identify overbought or oversold conditions. An RSI above 70 is considered overbought, suggesting a potential price decline, while an RSI below 30 is considered oversold, indicating a potential price increase.
On-Balance Volume (OBV)
OBV is a cumulative indicator that uses volume flow to predict changes in stock price. The theory behind OBV is that volume precedes price movement. If a stock closes higher than the previous day, volume is added to the OBV; if it closes lower, volume is subtracted. An increasing OBV suggests bullish sentiment, while a decreasing OBV indicates bearish sentiment.
Chaikin Money Flow (CMF)
The CMF combines price and volume to measure buying and selling pressure over a set period, usually 20 or 21 days. A positive CMF would indicate buying pressure and a potential price increase, while a negative CMF suggests selling pressure and a potential price decrease.
Conclusion
Combining fundamental and technical analysis provides a holistic view of an investment opportunity. Fundamental analysis offers insights into a company’s financial health and potential for growth, while technical analysis helps investors identify entry and exit points based on market trends and sentiment. Investors should use a blend of both methods to make informed decisions, considering the company’s financial stability, profitability, and market position, as well as prevailing market conditions and investor behavior.
If you have any questions or feedback, please send us email: contact@kavout.co