
Crypto News•1 week ago
Bitcoin (BTC) at a Crossroads: Make-or-Break Levels to Watch as Its Dominance Shakes Up the Market
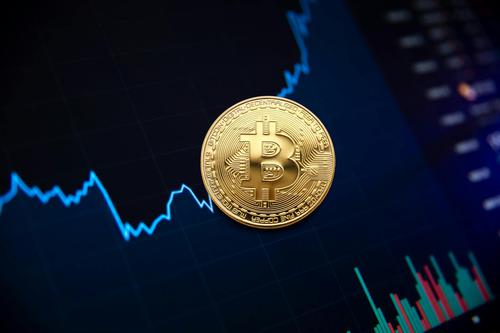
Bitcoin trades near $62.8K with a strong macro trend in bullish territory, as its dominance reshapes market dynamics.

Key Takeaways
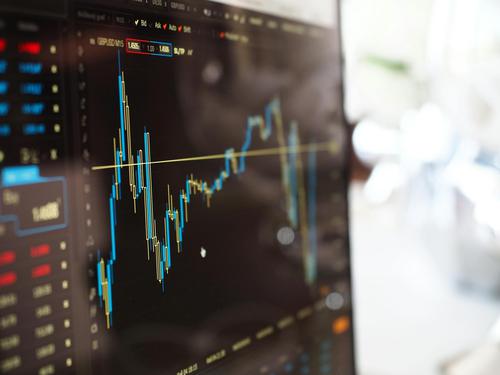
Bitcoin currently finds itself in a precarious consolidation phase, trading around $68,359.05 as of March 6, 2026, down 3.57% from its previous day's close of $70,887.60. This price action places it squarely at a critical juncture, testing the upper boundaries of a multi-month consolidation range between $60,000 and $72,000. The market's immediate future hinges on its ability to decisively break above or below this pivotal $72,000 level, which has emerged as a formidable resistance point.
This $72,000 threshold isn't just a psychological barrier; it represents a confluence of significant technical obstacles. It aligns with a Head and Shoulders neckline on higher timeframe charts, a pattern that, if confirmed with a decisive break lower, could trigger a substantial downside move. Moreover, the $70,000-$72,000 zone has acted as a persistent upper consolidation boundary, repeatedly rejecting bullish attempts. A sustained push above this level would invalidate several bearish technical structures, opening the door for a potential rally.
The current environment is characterized by a tug-of-war between underlying institutional accumulation and persistent selling pressure. Despite recent ETF inflows, the market remains in a "structurally defensive consolidation phase," as Glassnode analysts describe it. This means that while there's a foundational layer of institutional buying, it's not yet strong enough to overcome the overhead supply and propel Bitcoin into a clear uptrend. The $72,000 level is therefore not just a price point, but a battleground for the next major trend.
The stakes are high. A convincing close above $72,000 could quickly lead to a retest of the $74,000-$75,000 zone, where the 50-day Exponential Moving Average (EMA) currently sits at $75,836.71, and potentially higher towards $80,000. Conversely, a rejection at this level, especially if followed by a break below the lower consolidation boundary of $60,000-$62,500, could trigger a significant capitulation event. Investors are watching closely, as the outcome will dictate Bitcoin's trajectory for the coming months.
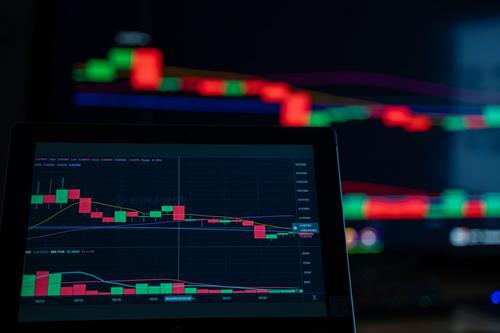
Despite recent price bounces, the technical landscape for Bitcoin remains fraught with bearish signals, suggesting significant downside risk if critical support levels fail. One prominent concern is the bear flag pattern that has developed since Bitcoin's October 2025 peak of $109,000+. This pattern, typically a continuation signal, suggests that the current consolidation could resolve with a further decline. The measured downside target of this bear flag points to a range of $42,000 to $45,000, a substantial drop from current levels.
Adding to the technical concerns is the Head and Shoulders neckline at $72,000. If Bitcoin fails to sustain a move above this level and instead breaks decisively below it, the technical measured move target points to an even deeper decline to $44,000. This scenario would represent a significant capitulation, wiping out gains from the August 2024 lows. The $60,000-$62,500 range has already been tested twice in late February, and a break below this key support would likely activate the $50,000 bear target, representing a 30% further downside from recent $71,000 levels.
The market's reaction to recent geopolitical events also casts a shadow on Bitcoin's "safe haven" narrative. During US-Israel strikes on Iran that killed Supreme Leader Khamenei and shut the Strait of Hormuz, gold surged 2% to $5,390 per ounce, while Bitcoin fell to $63,000. This divergence underscores that Bitcoin, at least for now, behaves more like a risk asset correlated with equities than a traditional safe haven. Adam Saville-Brown of Tesseract Group explicitly stated that "Bitcoin does not function as a safe haven when geopolitical risk materialises."
Furthermore, the Crypto Fear & Greed Index, while showing a slight uptick, still hovers in "Fear" territory, with a reading of 24. This indicates that despite some short-term rallies, the broader market sentiment remains cautious, lacking the conviction needed for a sustained uptrend. The 50-day moving average at $75,836.71 and the 200-day moving average at $96,130.14 both sit above the current price, indicating a bearish trend on longer timeframes. Until these technical and sentiment headwinds abate, the path of least resistance for Bitcoin appears to be lower.
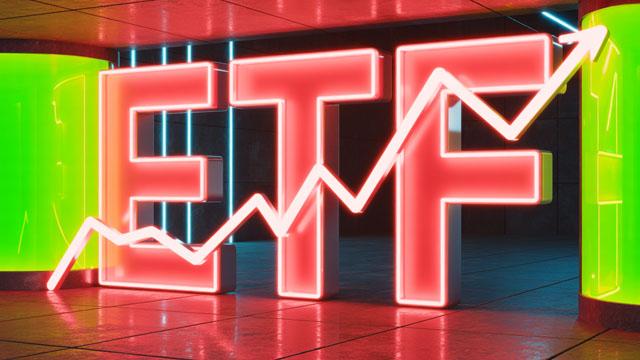
Despite the prevailing technical headwinds and cautious sentiment, a compelling bull case for Bitcoin is underpinned by its accelerating institutional adoption and ambitious long-term price targets from major financial players. The launch of spot Bitcoin ETFs in January 2024 has been a game-changer, attracting a combined $130 billion in assets under management (AUM) as of March 2026. BlackRock's IBIT alone holds approximately $67 billion, making it one of the fastest-growing ETFs in history, while Fidelity's FBTC holds roughly $30 billion. These products represent a structural shift, providing a regulated conduit for pension funds, family offices, and wealth management platforms to gain exposure to Bitcoin.
This institutional integration is creating a durable floor for Bitcoin, differentiating the current correction from previous bear markets. Unlike 2022, where price declines were met with institutional selling and forced liquidations, the 2025-2026 correction has seen sustained, albeit sometimes moderate, inflows into these ETF products. For instance, recent reports indicate $1.14 billion in net inflows across US spot BTC ETFs over three days, including a notable $787 million inflow on one day. This consistent demand from institutional players suggests a fundamental re-rating of Bitcoin as a legitimate asset class.
Looking ahead, institutional forecasts for Bitcoin's price trajectory remain remarkably bullish. JPMorgan's volatility-adjusted gold model suggests $170,000 is in play, while Fundstrat maintains an aggressive bull case of $400,000+. Standard Chartered, despite cutting its 2026 target from $300,000 to $150,000, still projects significant upside. Even more conservative estimates, like Carol Alexander's "high-volatility range between $75,000 and $150,000 with a central tendency around $110,000," point to substantial gains from current levels. These targets reflect a growing conviction in Bitcoin's long-term value proposition.
Beyond the numbers, regulatory clarity, particularly the potential passage of the US Clarity Act for digital assets, could serve as a powerful catalyst. Such legislation would de-risk the asset for many institutional investors, potentially unlocking a fresh wave of capital. While the current market is in a "wait-and-see" mode, with large whale activity subdued, a supportive regulatory environment could trigger the volume expansion and sentiment shift needed to propel Bitcoin past its resistance levels and towards these ambitious long-term targets.
The current Bitcoin market presents a fascinating paradox in sentiment, with prediction markets flashing bullish signals while the Crypto Fear & Greed Index remains firmly in "Fear" territory. This disconnect highlights the complex interplay of speculative positioning, technical analysis, and underlying market psychology. On one hand, prediction platforms like Myriad show traders assigning a 62% chance for Bitcoin to reach $75,000 in March, and an 11% probability of hitting $150,000 by year-end. This optimism suggests a strong belief in a near-term rally, driven by speculative bets on a price pump.
However, the Crypto Fear & Greed Index, which aggregates various market indicators like volatility, volume, social media sentiment, and search trends, paints a different picture. Despite a recent rebound from a low of 5 (Extreme Fear) to 16, the index currently sits at 24 (Fear). This level, while not "Extreme Fear," still reflects a market grappling with caution and uncertainty. Historically, extreme fear can signal a buying opportunity, but K33 research suggests the index functions more as a backward momentum indicator, correlating 0.71 with past performance but only 0.14 with future returns. This implies that while the market was fearful, it doesn't necessarily predict an immediate reversal.
The divergence between these two sentiment gauges can be attributed to their different methodologies and what they measure. Prediction markets reflect explicit bets on future price points, often driven by short-term technical setups or anticipated catalysts. They capture the conviction of active traders willing to put capital on specific outcomes. The Fear & Greed Index, conversely, provides a broader, more holistic view of collective market emotion, encompassing a wider range of participants and their psychological state. It's less about specific price targets and more about the underlying mood.
This tension creates a challenging environment for investors. The bullish bets in prediction markets might be fueled by the expectation of a short squeeze or a quick technical bounce, especially after deeply negative funding rates from recent geopolitical sell-offs cleared leverage from the system. Yet, the persistent "Fear" reading in the broader index suggests that this optimism is not widely shared, and the rally lacks the broad-based conviction from retail and long-term holders needed for sustained upward momentum. Until the Fear & Greed Index climbs above 25 into the "Fear" zone, signaling true stabilization, the market remains in a state of fragile conviction.
The recent geopolitical turmoil in the Middle East has definitively settled a long-standing debate within the crypto community: Bitcoin, for now, does not function as a safe haven asset. When US-Israel strikes on Iran escalated, leading to the death of Supreme Leader Khamenei and the closure of the Strait of Hormuz, traditional safe havens reacted as expected. Gold surged 2% to $5,390 per ounce, while Bitcoin, in stark contrast, fell to $63,000 before a subsequent recovery. This event provided a real-world stress test, confirming that Bitcoin's initial move was with equities, not gold.
This behavior underscores Bitcoin's increasing correlation with traditional risk assets, particularly the S&P 500. As of March 1, 2026, Bitcoin’s 30-day rolling correlation with the S&P 500 stood at 0.55, an increase from approximately 0.50 in October 2025. While not at crisis levels (which can reach 0.70-0.75), this elevated correlation means that when the S&P 500 experiences a sell-off due to macro fears—be it geopolitical shocks, tariff escalations, or disappointing economic data—Bitcoin tends to participate in that downward movement.
The very institutional integration that strengthens Bitcoin's long-term investment case also contributes to its short-term correlation with broader markets. As more traditional financial institutions, pension funds, and wealth managers gain exposure to Bitcoin through ETFs, they tend to treat it as part of their broader risk asset allocation. This means that during periods of market-wide de-risking, Bitcoin is often sold alongside other growth-oriented assets, rather than being sought out as a hedge against uncertainty.
This evolving risk profile is a crucial consideration for investors. The narrative of "digital gold" or an uncorrelated asset has largely been disproven by recent events. Instead, Bitcoin is increasingly behaving like a high-beta technology stock, sensitive to global liquidity conditions, interest rate expectations, and geopolitical stability. While its long-term potential for disruption and value appreciation remains, investors must acknowledge its current susceptibility to broad market sentiment and macroeconomic shifts. Understanding this reclassification is essential for proper portfolio allocation and risk management in the volatile crypto landscape.
For investors navigating Bitcoin's current landscape, the message is one of cautious optimism tempered by a clear understanding of risk. The immediate future hinges on the critical $72,000 level. A decisive break above this resistance, ideally accompanied by increased volume and sustained ETF inflows, could invalidate bearish technical patterns and open the path towards $80,000 and potentially the $110,000-$120,000 targets that many analysts foresee for 2026. This would signal a shift from defensive consolidation to a more robust accumulation phase.
Conversely, a failure to break $72,000, followed by a loss of the $60,000-$62,500 support zone, would activate significant downside targets, potentially leading to $50,000 or even $44,000. This scenario would confirm the bearish technical structures and likely trigger further capitulation among less conviction-driven holders. Conservative buyers might consider accumulating near the $65,376 support level with a stop-loss below $62,500, while more aggressive traders could await a confirmed break above $68,549 with volume.
Long-term investors should continue to consider dollar-cost averaging, leveraging the institutional floor provided by ETFs and the ambitious long-term price targets from major financial institutions. However, all investors must acknowledge Bitcoin's current classification as a risk asset, highly correlated with equities, rather than a safe haven. This implies that during broader market downturns or geopolitical shocks, Bitcoin is likely to experience similar selling pressure.
The market is currently in a "watchlist setup, not a trade," as some analysts suggest. Key catalysts to monitor include sustained ETF inflows (ideally half-billion dollar daily inflows), a rise in the Fear & Greed Index above 25 to confirm fading extreme fear, and, most critically, a decisive and sustained break above the $72,000 resistance level. Until these align, conviction remains fragile, and prudent risk management is paramount.
Bitcoin's current consolidation is a pivotal moment, demanding vigilance and a nuanced understanding of conflicting signals. While institutional adoption builds a long-term foundation, short-term technicals and market sentiment warn of potential volatility. Investors should prepare for either a significant breakout or a deeper correction, with $72,000 serving as the ultimate arbiter of its immediate trajectory.
Want deeper research on any stock? Try Kavout Pro for AI-powered analysis, smart signals, and more. Already a member? Add credits to run more research.