Technical Analysis of ACIO 2024-05-10
Overview:
In analyzing the technical indicators for ACIO over the last 5 days, we will delve into the trend, momentum, volatility, and volume indicators to provide a comprehensive assessment of the stock's potential price movement. By examining these key factors, we aim to offer valuable insights and predictions for the next few days.
Trend Analysis:
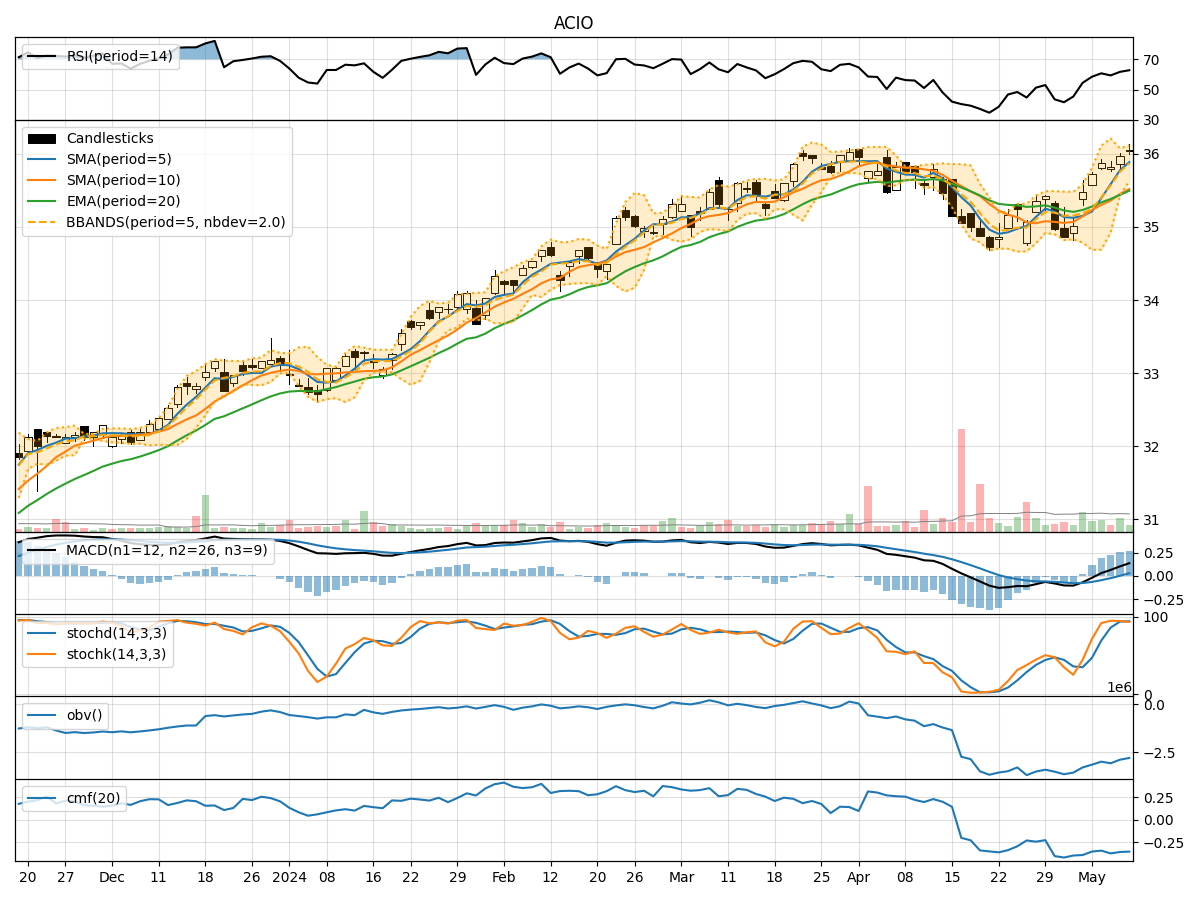
- Moving Averages (MA): The 5-day Moving Average (MA) has been consistently above the Simple Moving Average (SMA) and Exponential Moving Average (EMA), indicating a bullish trend.
- MACD: The MACD line has been consistently above the signal line, with both lines showing an upward trend, suggesting bullish momentum.
- Momentum: The stock price has been trending upwards, with the momentum indicators like RSI and Stochastic Oscillator signaling overbought conditions but still showing strength.
Momentum Analysis:
- RSI: The Relative Strength Index (RSI) has been in the overbought territory, indicating a strong bullish momentum.
- Stochastic Oscillator: Both %K and %D lines of the Stochastic Oscillator have been in the overbought zone, suggesting a strong upward momentum.
- Williams %R: The Williams %R is also in the oversold region, indicating a potential reversal in the short term.
Volatility Analysis:
- Bollinger Bands (BB): The Bollinger Bands have been narrowing, indicating decreasing volatility and a potential consolidation phase.
- Bollinger Band %B: The %B indicator has been hovering around 0.8, suggesting the stock is trading near the upper band, potentially overbought.
Volume Analysis:
- On-Balance Volume (OBV): The OBV has been showing a slight decrease, indicating some distribution happening in the stock.
- Chaikin Money Flow (CMF): The CMF has been negative, suggesting outflows from the stock.
Conclusion:
Based on the analysis of the technical indicators, the next few days' possible stock price movement for ACIO is likely to be sideways to slightly bearish. While the trend indicators show a bullish sentiment, the overbought conditions in momentum indicators and decreasing volume support a potential consolidation or minor pullback in the stock price. Traders should exercise caution and consider taking profits or implementing risk management strategies in anticipation of a short-term correction.
Key Recommendations:
- Monitor Overbought Conditions: Keep a close eye on the overbought signals from RSI and Stochastic Oscillator for potential reversal cues.
- Watch for Volume Confirmation: Look for volume confirmation to validate price movements and anticipate trend reversals.
- Set Stop-Loss Levels: Consider setting stop-loss levels to protect profits in case of a sudden downturn.
- Stay Informed: Stay updated on market news and events that could impact the stock's price movement.
By combining insights from trend, momentum, volatility, and volume indicators, traders can make informed decisions and navigate the market dynamics effectively. Remember to adapt your strategy based on real-time market conditions and adjust your positions accordingly.