Technical Analysis of ACSI 2024-05-10
Overview:
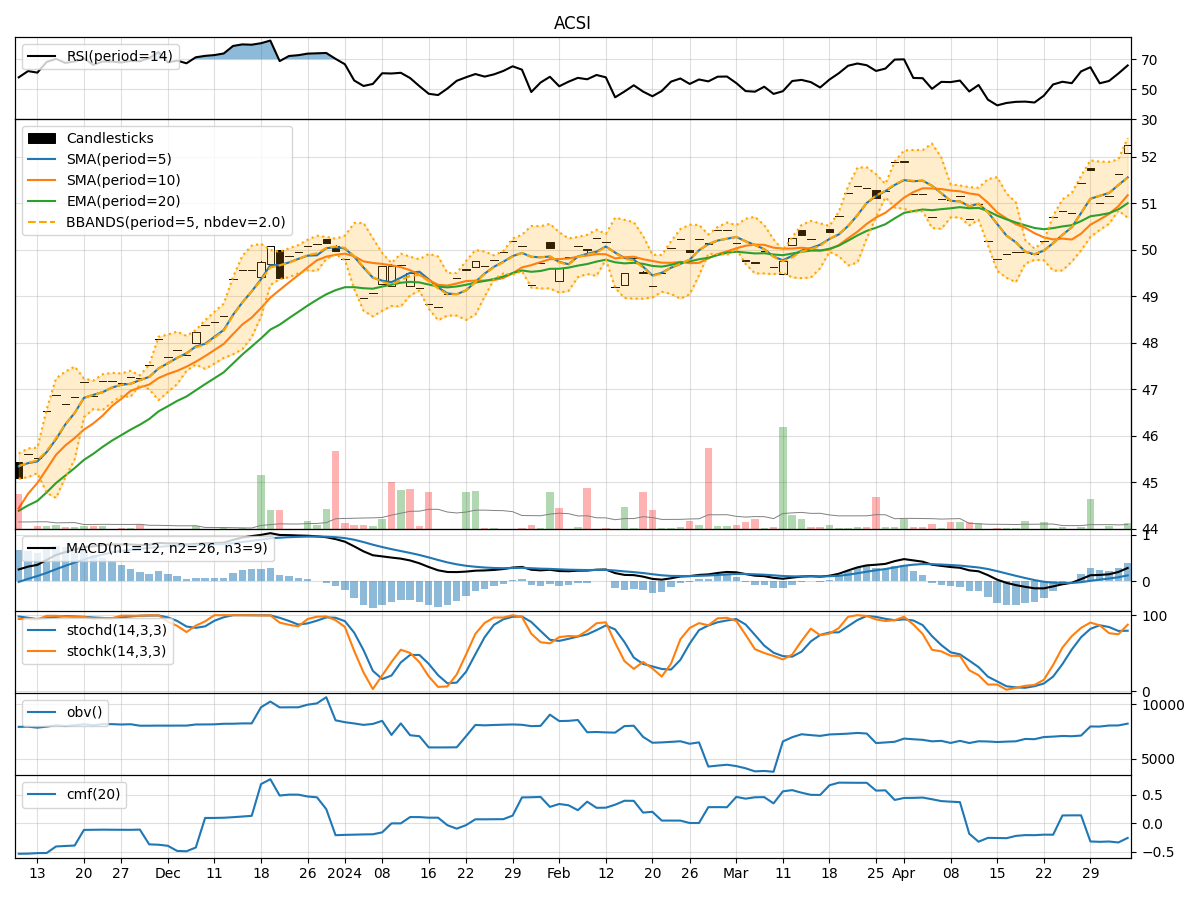
In analyzing the technical indicators for ACSI stock over the last 5 days, we will delve into the trend, momentum, volatility, and volume indicators to provide a comprehensive outlook on the possible stock price movement in the coming days. By examining key metrics such as moving averages, MACD, RSI, Bollinger Bands, and OBV, we aim to offer valuable insights and predictions for potential price trends.
Trend Indicators Analysis:
- Moving Averages (MA): The 5-day moving average has been consistently above the simple moving average (SMA) and exponential moving average (EMA), indicating a bullish trend.
- MACD: The MACD line has been consistently above the signal line, with both lines showing an upward trajectory, suggesting bullish momentum.
- MACD Histogram: The histogram has been increasing over the past 5 days, indicating strengthening bullish momentum.
Momentum Indicators Analysis:
- RSI: The RSI has been in the overbought territory above 70, indicating strong bullish momentum.
- Stochastic Oscillator: Both %K and %D have been at 100, signaling strong buying pressure.
- Williams %R: The indicator has consistently been at 0, reflecting an overbought condition.
Volatility Indicators Analysis:
- Bollinger Bands: The stock price has been consistently trading above the middle Bollinger Band, suggesting an upward trend.
- Bollinger Band Width: The band width has been narrowing, indicating decreasing volatility.
- Bollinger Band %B: The %B indicator has been above 0.5, indicating bullish momentum.
Volume Indicators Analysis:
- On-Balance Volume (OBV): The OBV has shown a slight increase over the last 5 days, indicating some accumulation.
- Chaikin Money Flow (CMF): The CMF has been negative, suggesting some selling pressure in the market.
Key Observations and Opinions:
- Trend: The trend indicators suggest a strong bullish sentiment in the stock.
- Momentum: Momentum indicators confirm the bullish trend with overbought conditions.
- Volatility: Volatility indicators point towards decreasing volatility and a potential continuation of the current trend.
- Volume: While OBV shows slight accumulation, CMF indicates some selling pressure.
Conclusion:
Based on the analysis of the technical indicators, the next few days' possible stock price movement for ACSI is likely to continue in an upward direction. The bullish trend, supported by strong momentum and decreasing volatility, indicates a favorable outlook for the stock. Traders and investors may consider buying opportunities in anticipation of further price appreciation.