Technical Analysis of ACTV 2024-05-10
Overview:
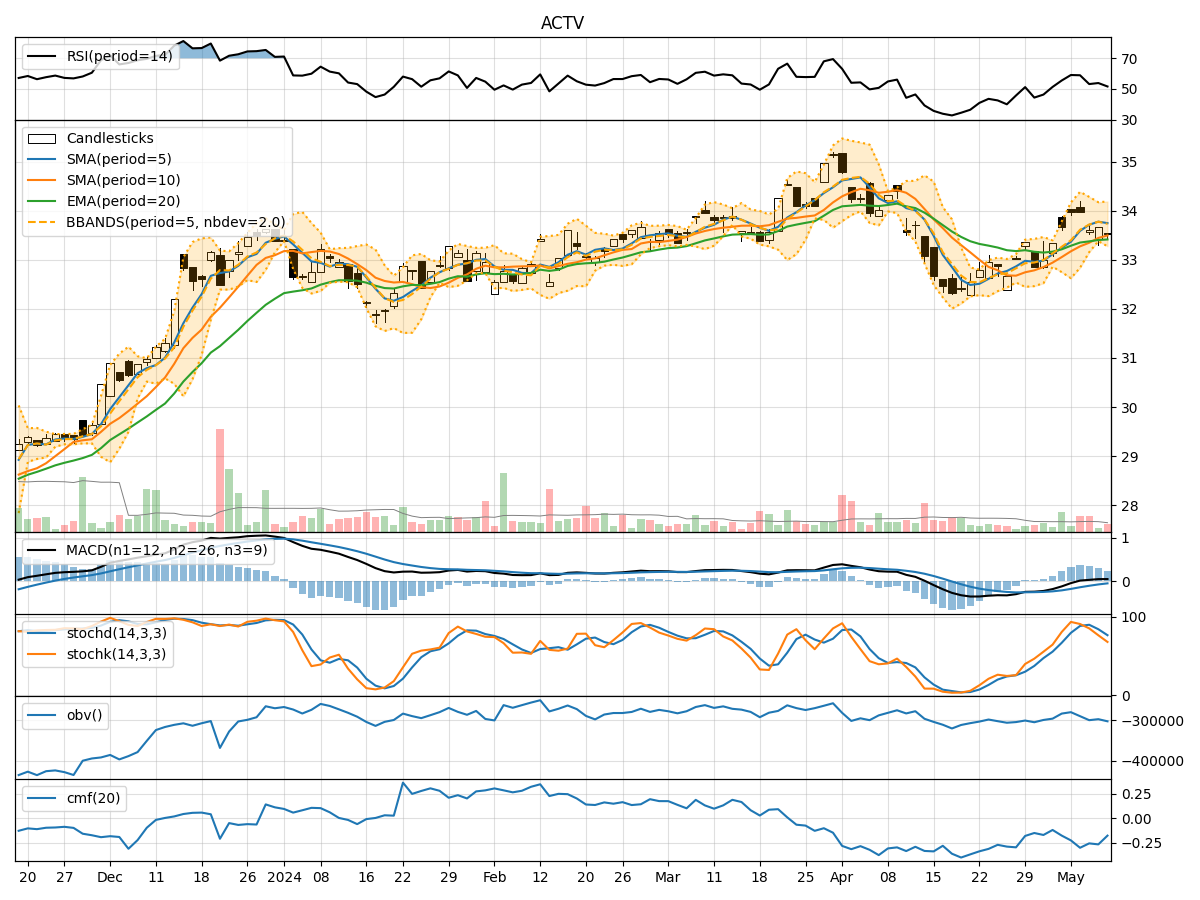
In the last 5 trading days, ACTV has shown mixed signals across various technical indicators. The stock price has been fluctuating within a narrow range, indicating indecision in the market. We will analyze the trend, momentum, volatility, and volume indicators to provide insights into the possible future stock price movement.
Trend Indicators:
- Moving Averages (MA): The 5-day MA has been fluctuating around the closing price, indicating short-term price stability. Both SMA(10) and EMA(20) have shown a slight upward trend, suggesting a potential bullish sentiment.
- MACD: The MACD line has been positive, indicating a bullish momentum. However, the MACD Histogram has been decreasing, signaling a potential weakening of the bullish momentum.
Momentum Indicators:
- RSI: The RSI has been hovering around the neutral zone, indicating a lack of strong buying or selling pressure.
- Stochastic Oscillator: Both %K and %D have been declining, suggesting a bearish momentum. The stock might be oversold in the short term based on the stochastic indicators.
Volatility Indicators:
- Bollinger Bands (BB): The stock price has been trading within the Bollinger Bands, indicating a period of consolidation. The bands are narrowing, suggesting a potential breakout in the near future.
- Bollinger %B: The %B indicator is close to 0.2, indicating that the stock is trading near the lower band, potentially signaling an oversold condition.
Volume Indicators:
- On-Balance Volume (OBV): The OBV has been declining, indicating that selling volume has been higher than buying volume in the recent days.
- Chaikin Money Flow (CMF): The CMF has been negative, suggesting that money is flowing out of the stock. This indicates a bearish sentiment in terms of volume flow.
Conclusion:
Based on the analysis of the technical indicators, the stock is currently in a sideways consolidation phase with a slight bearish bias. The mixed signals from the trend, momentum, volatility, and volume indicators suggest that the stock price may continue to fluctuate within a narrow range in the near term. Traders should exercise caution and wait for clearer signals before taking any significant positions. A wait-and-see approach is recommended until a clearer trend emerges in the market.
Key Points:
- Trend: Slight bullish sentiment based on moving averages, but weakening momentum indicated by MACD.
- Momentum: Bearish momentum suggested by stochastic indicators, while RSI indicates neutrality.
- Volatility: Consolidation phase with potential for a breakout, %B indicator shows oversold condition.
- Volume: Selling pressure indicated by OBV and CMF, signaling a bearish volume flow.
Recommendation:
- Short Term: Expect further sideways movement with a bearish bias.
- Medium to Long Term: Monitor for a potential breakout or trend reversal before considering significant positions.
- Risk Management: Set clear stop-loss levels and consider waiting for stronger confirmation signals before making trading decisions.
By carefully monitoring the evolving market dynamics and key technical indicators, investors can make more informed decisions and adapt their strategies accordingly.