Technical Analysis of ACWI 2024-05-10
Overview:
In analyzing the technical indicators for the ACWI stock over the last 5 days, we will delve into the trend, momentum, volatility, and volume indicators to provide a comprehensive outlook on the possible stock price movement in the coming days. By examining these key indicators, we aim to offer valuable insights and recommendations for potential investors.
Trend Indicators:
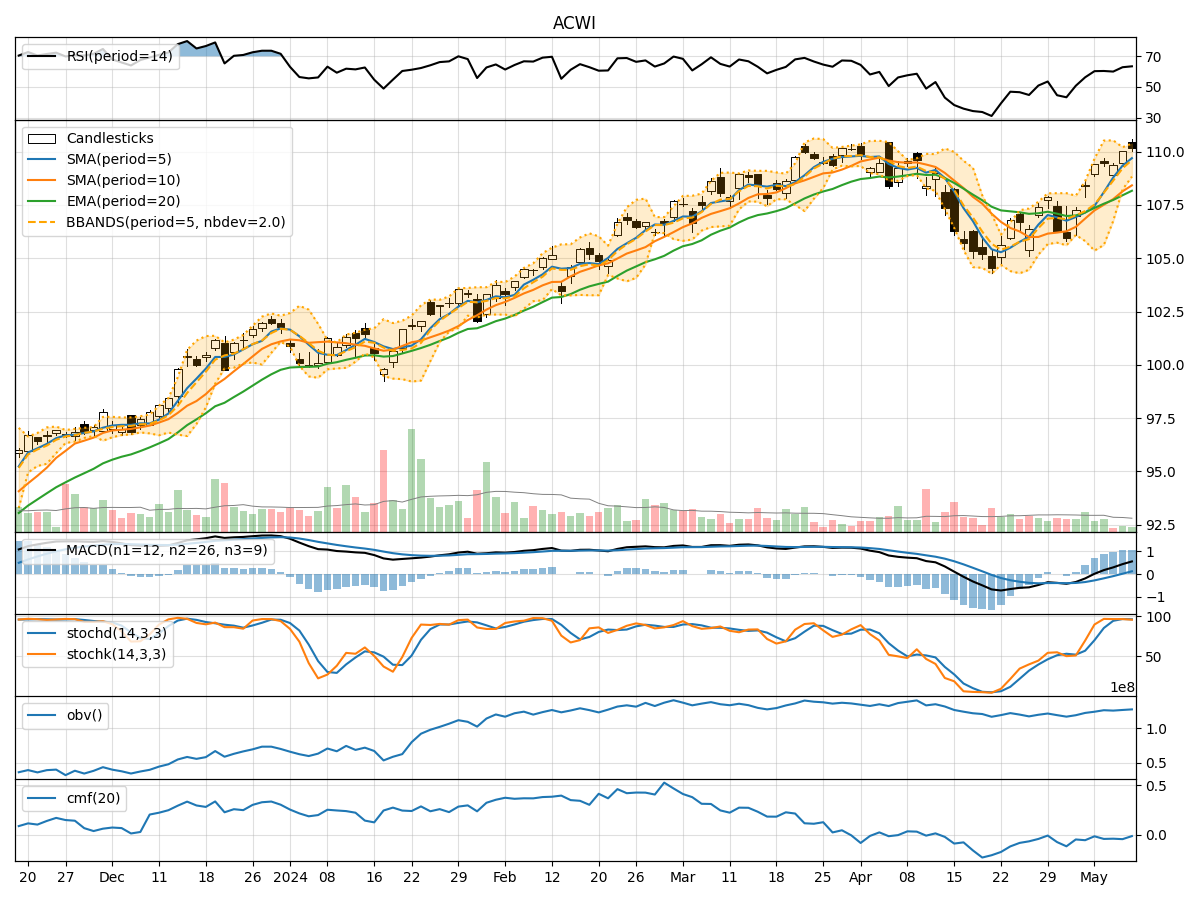
- Moving Averages (MA): The 5-day Moving Average (MA) has been consistently rising, indicating a bullish trend in the short term.
- MACD: The MACD line has been above the signal line for the past few days, suggesting a bullish momentum.
- EMA: The Exponential Moving Average (EMA) has been steadily increasing, supporting the bullish trend.
Key Observation: The trend indicators point towards an upward movement in the stock price.
Momentum Indicators:
- RSI: The Relative Strength Index (RSI) has been in the neutral to slightly overbought territory, indicating a balanced momentum.
- Stochastic Oscillator: Both %K and %D have been relatively high, suggesting a strong bullish momentum.
- Williams %R: The Williams %R is showing oversold conditions, potentially signaling a reversal.
Key Observation: The momentum indicators reflect a bullish sentiment in the market.
Volatility Indicators:
- Bollinger Bands: The Bollinger Bands are narrowing, indicating decreasing volatility and a possible period of consolidation.
Key Observation: Volatility is decreasing, suggesting a sideways movement in the stock price.
Volume Indicators:
- On-Balance Volume (OBV): The OBV has been fluctuating but generally maintaining a neutral stance.
- Chaikin Money Flow (CMF): The CMF has been negative, indicating selling pressure in the market.
Key Observation: Volume indicators are inconclusive, suggesting a neutral stance.
Conclusion:
Based on the analysis of the technical indicators, the overall outlook for the ACWI stock in the next few days is bullish with a potential upward movement in price. The trend and momentum indicators strongly support a bullish sentiment, while the volatility indicators point towards a period of consolidation. However, the volume indicators remain neutral, indicating a lack of strong buying or selling pressure.
In conclusion, the stock is likely to experience an upward movement in the coming days, with potential periods of consolidation due to decreasing volatility. Investors may consider entering long positions based on the bullish trend and momentum signals, while closely monitoring volume dynamics for confirmation of market sentiment.