Technical Analysis of ACWX 2024-05-10
Overview:
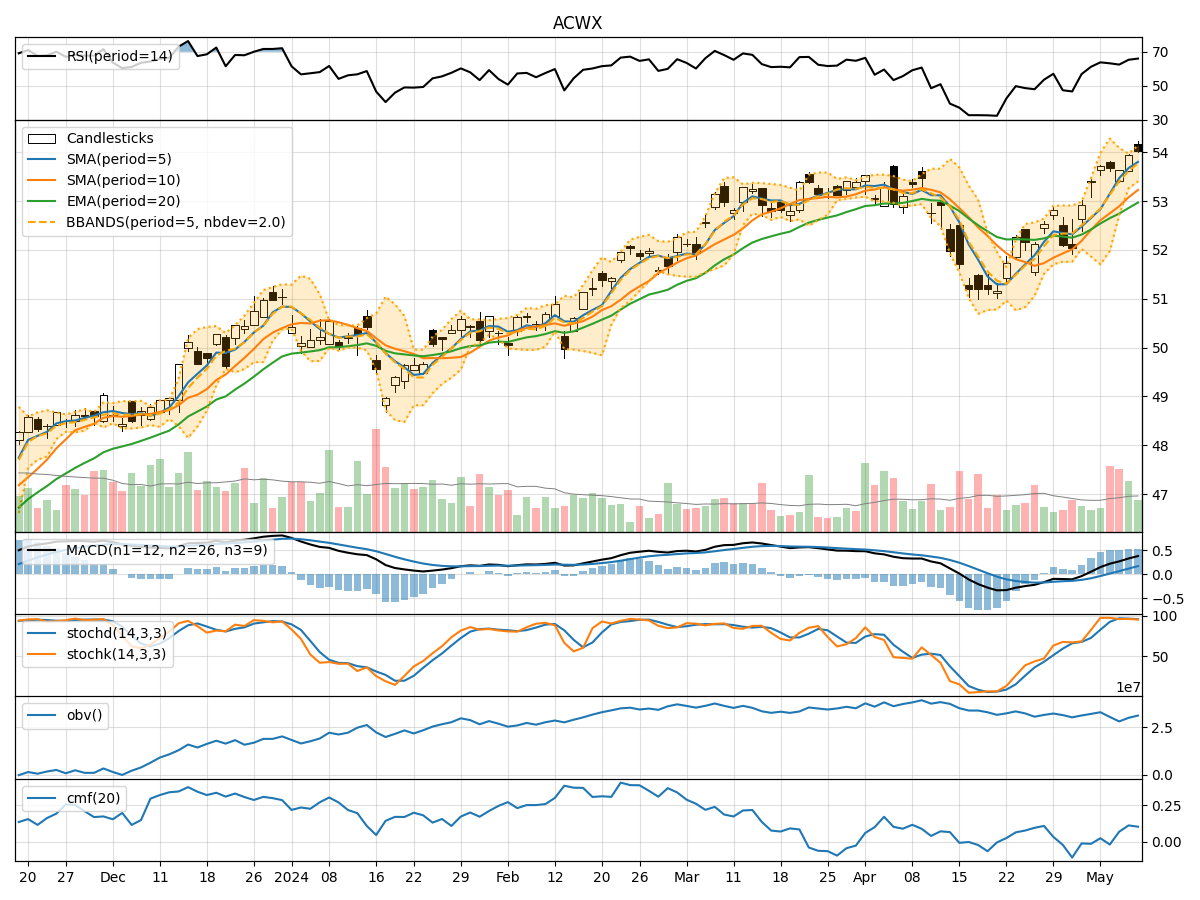
In analyzing the technical indicators for ACWX over the last 5 days, we will delve into the trend, momentum, volatility, and volume indicators to provide a comprehensive outlook on the possible stock price movement in the coming days.
Trend Analysis:
- Moving Averages (MA): The 5-day Moving Average has been consistently above the Simple Moving Average (SMA) and Exponential Moving Average (EMA), indicating a bullish trend.
- MACD: The MACD line has been consistently above the signal line, with both lines showing an upward trend, suggesting bullish momentum.
Momentum Analysis:
- RSI: The Relative Strength Index (RSI) has been in the overbought territory, indicating a strong bullish momentum.
- Stochastic Oscillator: Both %K and %D have been in the overbought zone, suggesting a potential reversal or consolidation.
Volatility Analysis:
- Bollinger Bands (BB): The stock price has been trading within the upper Bollinger Band, indicating an overbought condition.
Volume Analysis:
- On-Balance Volume (OBV): The OBV has shown mixed signals, with fluctuations in volume accumulation.
- Chaikin Money Flow (CMF): The CMF has been positive, indicating buying pressure in the market.
Key Observations:
- The trend indicators suggest a strong bullish sentiment in the short term.
- Momentum indicators signal potential overbought conditions, hinting at a possible correction or consolidation.
- Volatility indicators point towards an overbought market, which may lead to a price pullback.
- Volume indicators show mixed signals, reflecting uncertainty in market participation.
Conclusion:
Based on the analysis of technical indicators, the stock price of ACWX is likely to experience a short-term correction or consolidation due to the overbought conditions indicated by momentum and volatility indicators. Traders should exercise caution and consider taking profits or implementing risk management strategies. The overall trend remains bullish, but a period of sideways movement or a slight pullback is probable in the coming days. It is advisable to monitor key support levels and wait for clearer signals before making significant trading decisions.