Technical Analysis of ADIV 2024-05-10
Overview:
In analyzing the technical indicators for the stock based on the last 5 days of data, we will delve into the trend, momentum, volatility, and volume indicators to provide a comprehensive outlook on the possible stock price movement in the coming days. By examining these key indicators, we aim to offer valuable insights and recommendations for potential investors.
Trend Indicators:
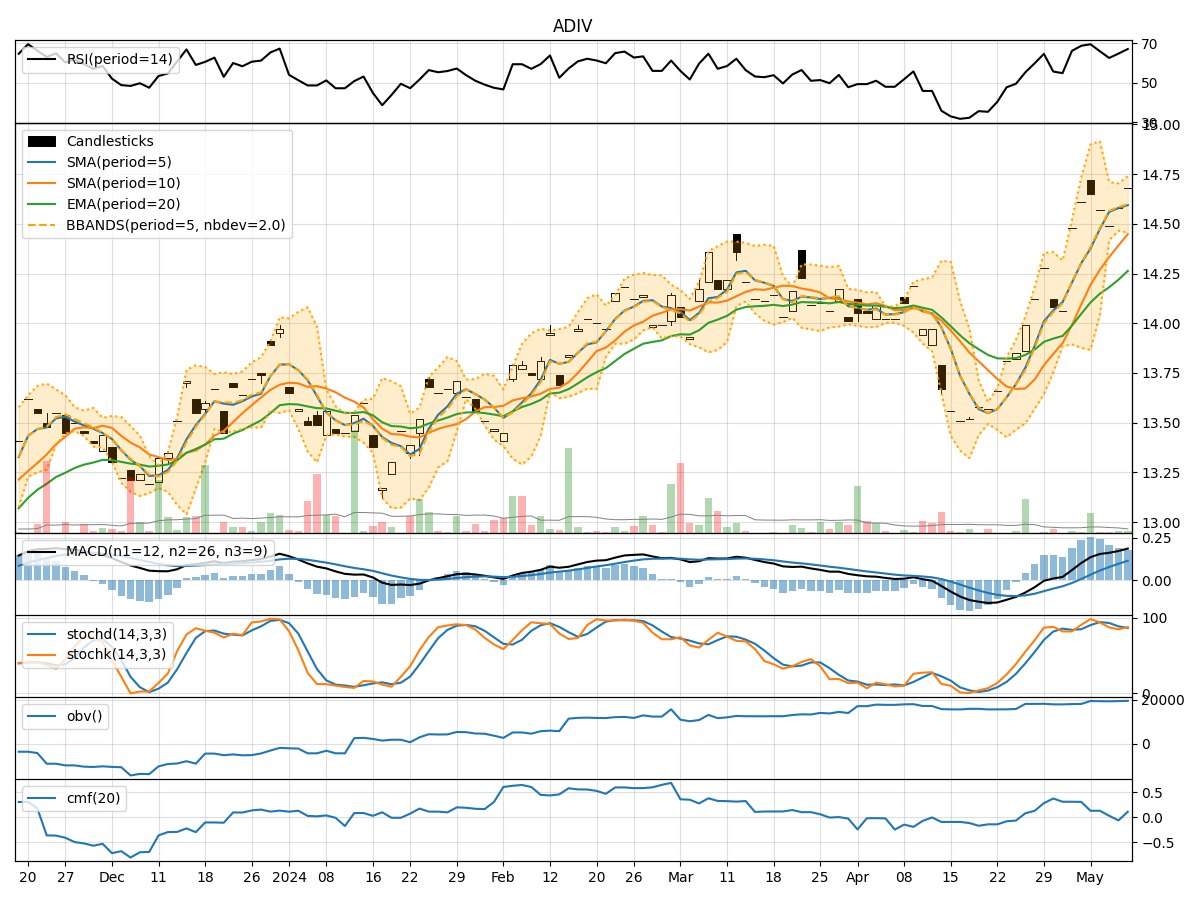
- Moving Averages (MA): The stock's closing prices have been consistently above the 5-day Moving Average, indicating a short-term uptrend.
- MACD (Moving Average Convergence Divergence): The MACD line has been above the signal line, suggesting bullish momentum.
- EMA (Exponential Moving Average): The EMA has been trending upwards, supporting the bullish sentiment.
Momentum Indicators:
- RSI (Relative Strength Index): The RSI has been in the overbought territory, indicating a strong bullish momentum.
- Stochastic Oscillator: Both %K and %D have been relatively high, signaling potential overbought conditions.
- Williams %R (Willams Percentage Range): The stock has been in the oversold region, suggesting a possible reversal.
Volatility Indicators:
- Bollinger Bands: The stock price has been trading within the upper Bollinger Band, indicating increased volatility and a potential overbought condition.
- Bollinger Band Width: The Band Width has been expanding, suggesting a widening price range and heightened volatility.
Volume Indicators:
- On-Balance Volume (OBV): The OBV has shown mixed signals, fluctuating between positive and negative values.
- Chaikin Money Flow (CMF): The CMF has been positive, indicating buying pressure in the stock.
Key Observations and Opinions:
- Trend: The stock is in a clear uptrend based on moving averages and MACD.
- Momentum: The momentum indicators suggest a strong bullish sentiment but also hint at potential overbought conditions.
- Volatility: Increased volatility, as indicated by Bollinger Bands, could lead to sharp price movements.
- Volume: The volume indicators show mixed signals, reflecting uncertainty in market participation.
Conclusion:
Based on the analysis of the technical indicators, the stock is likely to experience further upside movement in the coming days. However, caution is advised due to potential overbought conditions and increased volatility. Investors should closely monitor price action and consider setting appropriate stop-loss levels to manage risk effectively.