Technical Analysis of AFIF 2024-05-10
Overview:
In analyzing the technical indicators for AFIF stock over the last 5 days, we will delve into the trends, momentum, volatility, and volume indicators to provide a comprehensive outlook on the possible future stock price movement. By examining these key indicators, we aim to offer valuable insights and predictions for the upcoming trading days.
Trend Analysis:
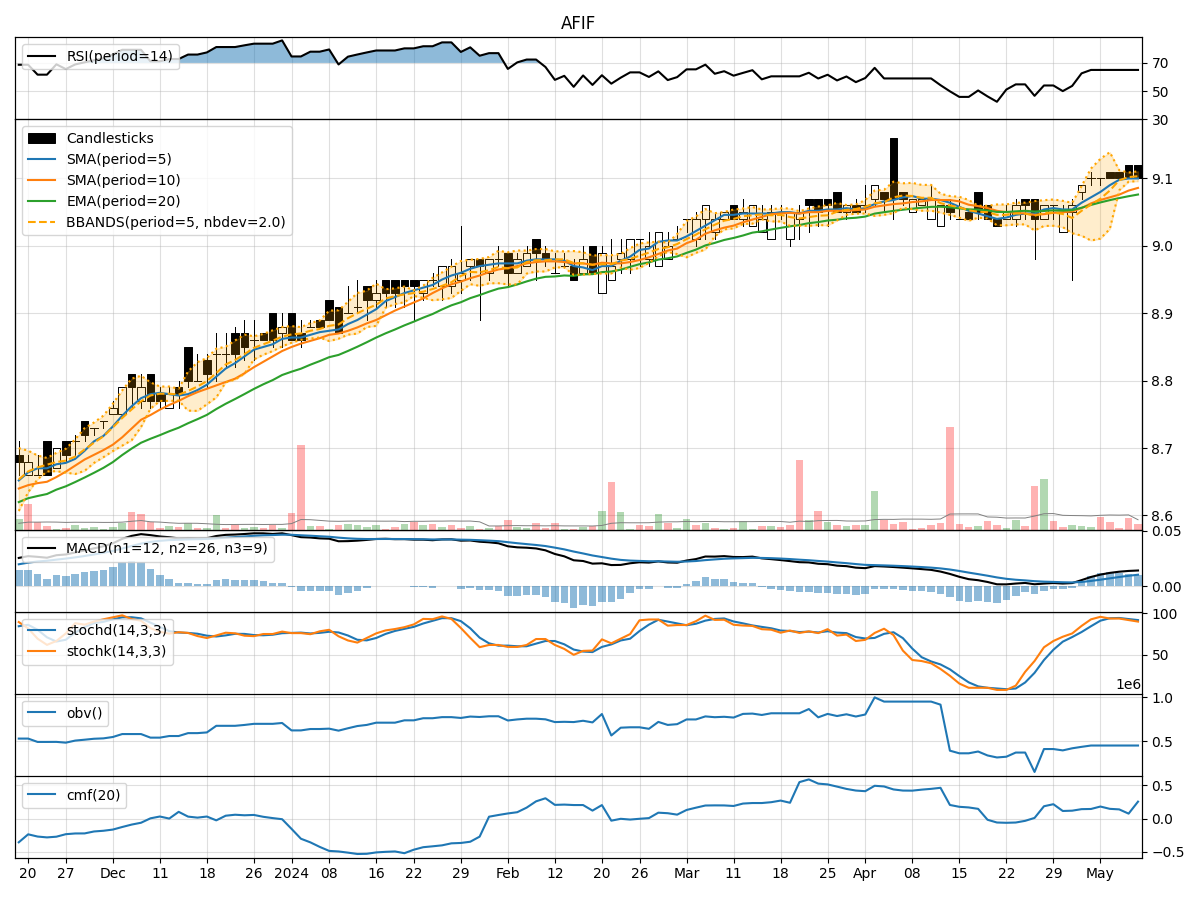
- Moving Averages (MA): The 5-day Moving Average (MA) has been relatively stable at around 9.1, indicating a consistent price level.
- MACD: The MACD line has shown a positive trend, increasing from 0.010604 to 0.014262 over the last 5 days.
- EMA: The Exponential Moving Average (EMA) has also exhibited an upward trajectory, suggesting a bullish sentiment in the short term.
Key Observation: The trend indicators suggest a bullish outlook for AFIF stock in the near future.
Momentum Analysis:
- RSI: The Relative Strength Index (RSI) has remained around 64.94, indicating a balanced momentum without extreme overbought or oversold conditions.
- Stochastic Oscillator: Both %K and %D values have been gradually decreasing, signaling a potential slowdown in momentum.
- Williams %R: The Williams %R indicator has hovered around -11.76, reflecting a slightly oversold condition.
Key Observation: The momentum indicators suggest a neutral to slightly bearish momentum for AFIF stock in the upcoming days.
Volatility Analysis:
- Bollinger Bands: The Bollinger Bands have narrowed, indicating decreased volatility and a potential period of consolidation.
- Bollinger %B: The %B value has consistently been at 1.0, suggesting that the stock price is at the upper band limit.
Key Observation: The volatility indicators point towards a consolidation phase for AFIF stock in the near future.
Volume Analysis:
- On-Balance Volume (OBV): The OBV has remained constant at -273248.0, indicating a lack of significant volume accumulation or distribution.
- Chaikin Money Flow (CMF): The CMF value has fluctuated but has not shown a clear trend, reflecting uncertainty in volume flow.
Key Observation: The volume indicators suggest a neutral volume sentiment for AFIF stock in the upcoming trading days.
Conclusion:
Based on the analysis of trend, momentum, volatility, and volume indicators, the overall outlook for AFIF stock in the next few days is as follows:
- Trend: Upward trend based on moving averages and MACD.
- Momentum: Neutral to slightly bearish momentum based on RSI and Stochastic Oscillator.
- Volatility: Consolidation phase indicated by Bollinger Bands.
- Volume: Neutral volume sentiment based on OBV and CMF.
Final Verdict:
Considering the collective analysis of technical indicators, AFIF stock is likely to experience a sideways movement with a potential for a slight upward bias in the upcoming trading days. Traders may consider monitoring key support and resistance levels for potential entry and exit points.