Technical Analysis of AFLG 2024-05-10
Overview:
In analyzing the technical indicators for AFLG over the last 5 days, we will delve into the trend, momentum, volatility, and volume indicators to provide a comprehensive outlook on the possible stock price movement in the coming days. By examining these key aspects, we aim to offer valuable insights and predictions for potential investors.
Trend Analysis:
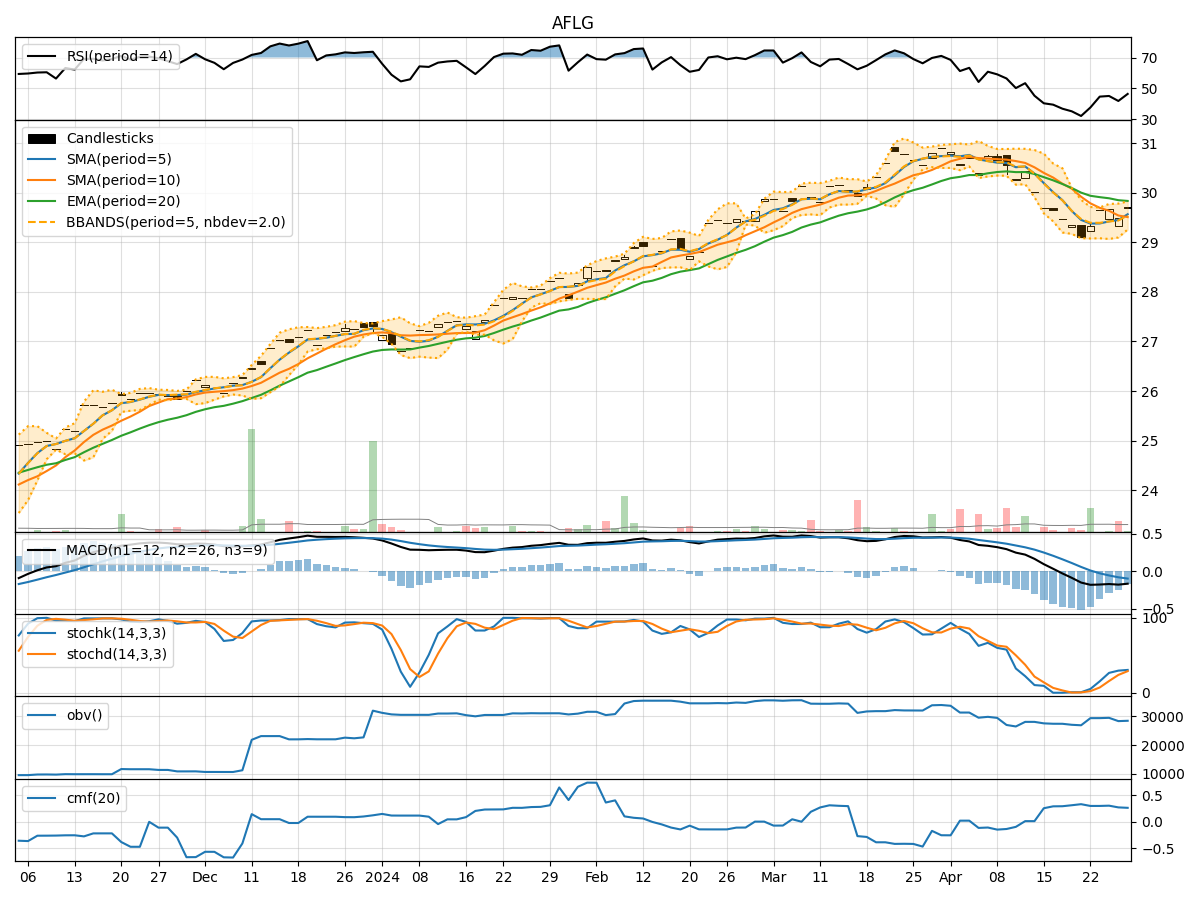
- Moving Averages (MA): The 5-day MA has been consistently above the closing prices, indicating a bullish trend.
- MACD: The MACD line has been above the signal line, suggesting a bullish momentum.
- RSI: The RSI has been trending upwards, indicating increasing buying pressure.
Key Observation: The trend indicators point towards a bullish sentiment in the stock.
Momentum Analysis:
- Stochastic Oscillator: Both %K and %D have been consistently high, indicating strong upward momentum.
- Williams %R: The indicator has been hovering around 0, suggesting a potential overbought condition.
Key Observation: Momentum indicators reflect a strong bullish momentum in the stock.
Volatility Analysis:
- Bollinger Bands (BB): The stock price has been trading within the bands, with the %B indicator showing a slight uptrend.
- Average True Range (ATR): The ATR values have been relatively stable, indicating consistent volatility levels.
Key Observation: Volatility indicators suggest a stable price movement with a slight uptrend.
Volume Analysis:
- On-Balance Volume (OBV): The OBV has shown positive accumulation, indicating buying interest in the stock.
- Chaikin Money Flow (CMF): The CMF has been positive, signaling a healthy inflow of money into the stock.
Key Observation: Volume indicators point towards positive buying activity in the stock.
Conclusion:
Based on the analysis of the technical indicators, the overall outlook for AFLG stock is bullish. The trend indicators, momentum indicators, volatility indicators, and volume indicators all align in signaling a potential upward movement in the stock price. Investors may consider taking long positions or holding onto existing positions to benefit from the expected bullish trend in the coming days.
Key Takeaways:
- Upward Momentum: The stock shows strong bullish momentum based on the Stochastic Oscillator and RSI.
- Stable Volatility: Volatility levels are stable, indicating a controlled price movement.
- Positive Volume: Accumulation in OBV and positive CMF suggest a healthy buying interest in the stock.
In conclusion, considering the collective strength of the technical indicators, the next few days are likely to see an upward movement in AFLG stock price.