Technical Analysis of AFMC 2024-05-10
Overview:
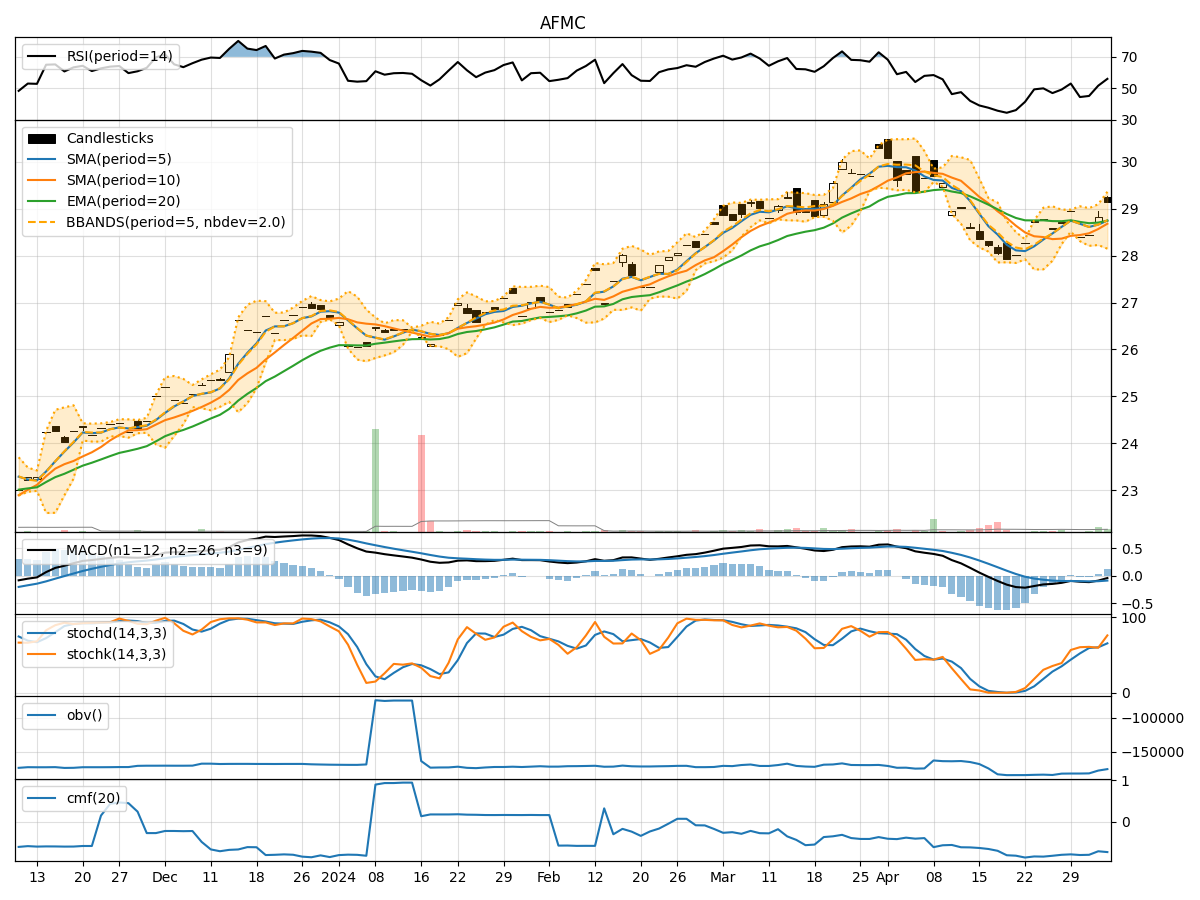
In the last 5 trading days, AFMC stock has shown a consistent uptrend in its price, supported by increasing volume and positive momentum indicators. The stock has also exhibited low volatility, indicating a stable price movement. However, there are signs of potential overbought conditions based on the momentum indicators. Let's delve deeper into each category of technical indicators to provide a comprehensive analysis and make a prediction for the next few days.
Trend Indicators:
- Moving Averages (MA): The 5-day MA has been consistently above the 10-day SMA, indicating a short-term bullish trend. The EMA(20) has been steadily increasing, supporting the uptrend.
- MACD: The MACD line has been above the signal line for the past 5 days, indicating bullish momentum. The MACD histogram has also been positive, suggesting further upside potential.
Momentum Indicators:
- RSI: The RSI has been in the overbought territory, indicating a potential reversal or consolidation in the near term.
- Stochastic Oscillator: Both %K and %D have been in the overbought zone for the entire period, signaling a possible pullback or consolidation.
- Williams %R: The indicator has consistently been at or near the oversold level, suggesting a potential reversal to the upside.
Volatility Indicators:
- Bollinger Bands: The stock price has been trading within the bands, showing low volatility. The bands are relatively narrow, indicating a period of consolidation.
- Bollinger %B: The %B indicator has been hovering around 0.8, suggesting the stock is trading near the upper band.
Volume Indicators:
- On-Balance Volume (OBV): The OBV has been declining, indicating some distribution happening in the stock.
- Chaikin Money Flow (CMF): The CMF has been negative, suggesting outflows from the stock.
Conclusion:
Based on the analysis of the technical indicators, the stock is currently in an overbought state with signs of potential reversal or consolidation in the near term. The uptrend may lose momentum, and a pullback or sideways movement is likely. Traders should exercise caution and consider taking profits or implementing risk management strategies. It is advisable to wait for confirmation of a new trend direction before making significant trading decisions.