Technical Analysis of AFSM 2024-05-10
Overview:
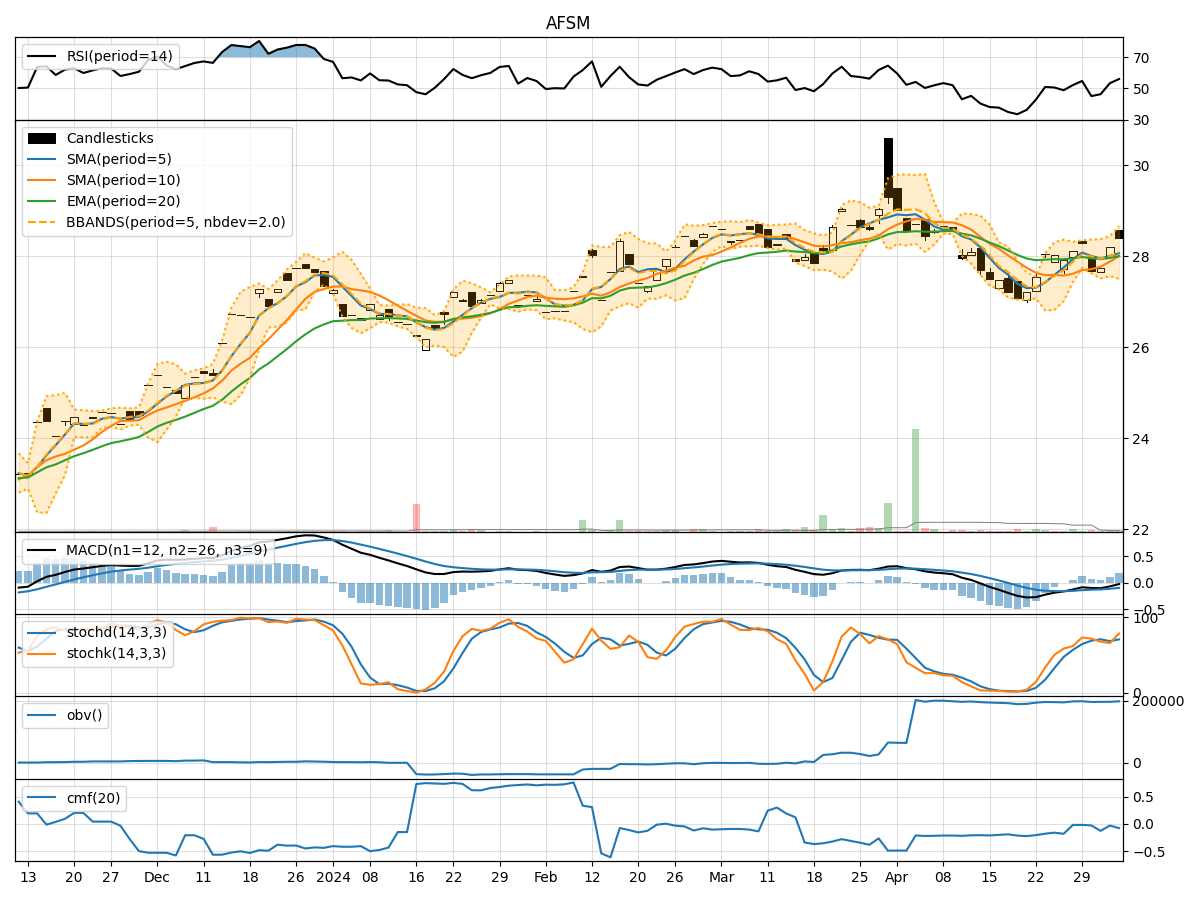
In analyzing the technical indicators for AFSM stock over the last 5 days, we will delve into the trend, momentum, volatility, and volume indicators to provide a comprehensive outlook on the possible stock price movement in the coming days. By examining these key indicators, we aim to offer valuable insights and predictions for potential investors.
Trend Indicators:
- Moving Averages (MA): The 5-day moving average has been consistently above the simple moving average (SMA) and exponential moving average (EMA), indicating a bullish trend.
- MACD: The MACD line has been consistently above the signal line, suggesting a positive momentum in the stock price.
Momentum Indicators:
- RSI: The Relative Strength Index (RSI) has been hovering around 60-62, indicating a neutral momentum in the stock.
- Stochastic Oscillator: Both %K and %D lines of the Stochastic Oscillator have been in the overbought zone, signaling a potential reversal or consolidation.
Volatility Indicators:
- Bollinger Bands (BB): The stock price has been trading within the Bollinger Bands, with the bands narrowing, suggesting a decrease in volatility.
Volume Indicators:
- On-Balance Volume (OBV): The OBV has been relatively stable, indicating a balance between buying and selling pressure.
- Chaikin Money Flow (CMF): The CMF has been negative, reflecting a slight bearish sentiment in the stock.
Key Observations:
- The trend indicators suggest a bullish outlook, supported by the moving averages and MACD.
- Momentum indicators show a neutral stance, with the RSI indicating neither overbought nor oversold conditions.
- Volatility indicators point towards decreasing volatility, potentially leading to a period of consolidation.
- Volume indicators reflect a balanced market sentiment, with no significant divergence in buying or selling pressure.
Conclusion:
Based on the analysis of the technical indicators, the stock is likely to experience a period of consolidation in the upcoming days. The bullish trend indicated by moving averages and MACD may stabilize, while the decreasing volatility and neutral momentum suggest a sideways movement. Investors should closely monitor the Stochastic Oscillator for potential reversal signals and the OBV for any shifts in buying or selling pressure. Overall, a cautious approach is recommended, with a focus on risk management strategies in the current market environment.