Technical Analysis of AFTY 2024-05-10
Overview:
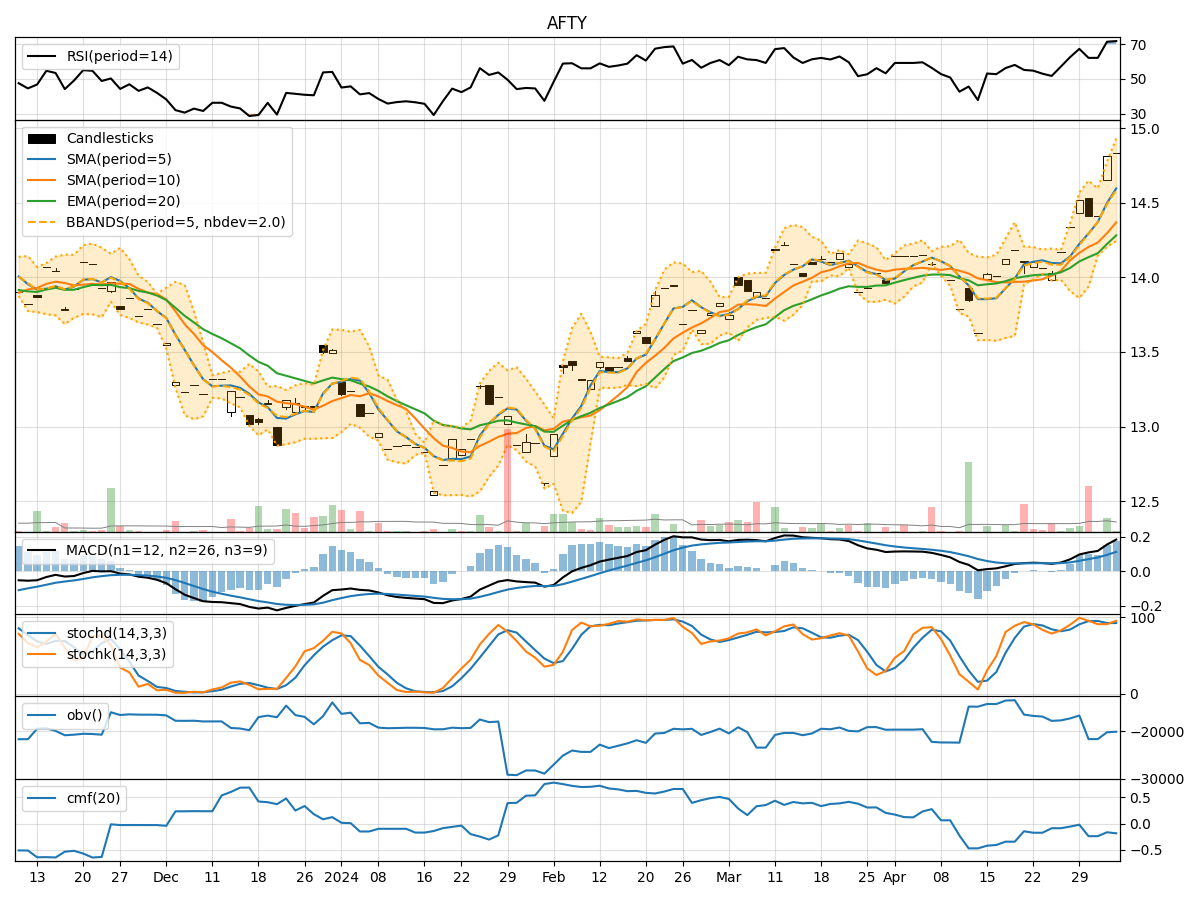
In the last 5 trading days, AFTY stock has shown mixed signals across various technical indicators. The trend indicators suggest a slightly bullish sentiment with the moving averages trending upwards. Momentum indicators indicate a neutral to slightly bearish momentum, while volatility indicators show a narrowing of the Bollinger Bands, indicating potential consolidation. Volume indicators also show mixed signals with fluctuations in On-Balance Volume (OBV) and Chaikin Money Flow (CMF).
Trend Indicators:
- Moving Averages (MA): The 5-day MA is above both the 10-day SMA and 20-day EMA, indicating a short-term bullish trend.
- MACD: The MACD line is above the signal line, suggesting bullish momentum.
- MACD Histogram: The histogram is positive, indicating increasing bullish momentum.
Momentum Indicators:
- RSI: The RSI is in the neutral zone around 50, suggesting a lack of strong momentum in either direction.
- Stochastic Oscillator: Both %K and %D are below 80, indicating a potential bearish crossover.
- Williams %R: The indicator is close to oversold levels, suggesting a possible bullish reversal.
Volatility Indicators:
- Bollinger Bands (BB): The bands are narrowing, indicating decreasing volatility and a potential period of consolidation.
- Bollinger %B: The %B is below 1, suggesting the stock is trading below the lower band.
Volume Indicators:
- On-Balance Volume (OBV): The OBV has shown fluctuations, indicating mixed buying and selling pressure.
- Chaikin Money Flow (CMF): The CMF is negative, suggesting a bearish money flow.
Key Observations:
- The trend indicators point towards a bullish sentiment in the short term.
- Momentum indicators show a lack of strong momentum in either direction.
- Volatility indicators suggest a potential period of consolidation.
- Volume indicators indicate mixed buying and selling pressure.
Conclusion:
Based on the analysis of the technical indicators, the next few days for AFTY stock are likely to see sideways movement or consolidation. The bullish trend indicated by moving averages and MACD may be limited by the lack of strong momentum and negative money flow. The narrowing Bollinger Bands also suggest a period of consolidation. Traders should exercise caution and wait for clearer signals before making significant trading decisions.