Technical Analysis of AGIH 2024-05-10
Overview:
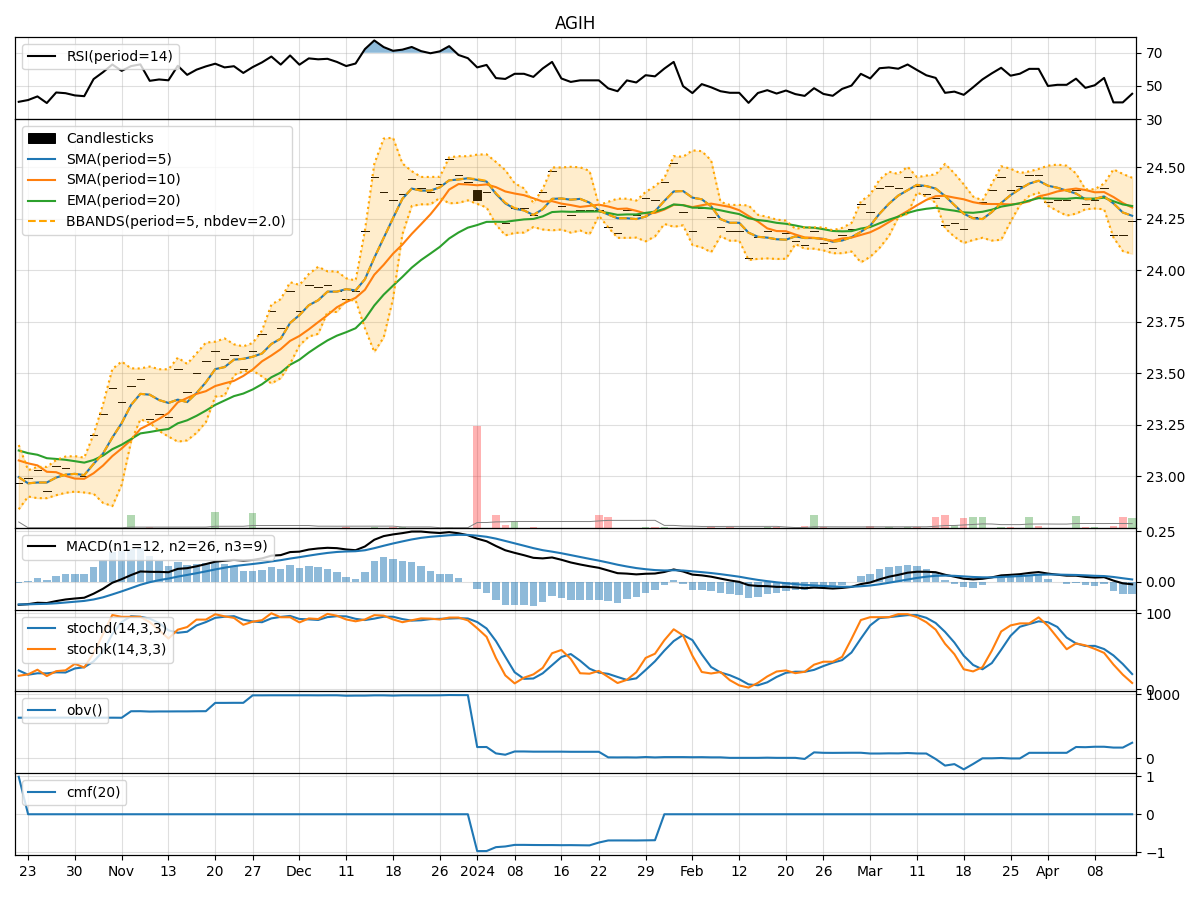
In analyzing the technical indicators for AGIH over the last 5 days, we will delve into the trend, momentum, volatility, and volume indicators to provide a comprehensive outlook on the possible stock price movement in the coming days.
Trend Analysis:
- Moving Averages (MA): The 5-day Moving Average (MA) has been consistently above the Simple Moving Average (SMA) and Exponential Moving Average (EMA), indicating a short-term uptrend.
- MACD: The Moving Average Convergence Divergence (MACD) has been positive and increasing, suggesting bullish momentum.
- Conclusion: The trend indicators point towards an upward trend in the stock price.
Momentum Analysis:
- RSI: The Relative Strength Index (RSI) has been fluctuating around the neutral zone, indicating indecision in momentum.
- Stochastic Oscillator: Both %K and %D have been declining, signaling a potential reversal in momentum.
- Conclusion: The momentum indicators suggest a sideways movement or a possible reversal in momentum.
Volatility Analysis:
- Bollinger Bands (BB): The stock price has been trading within the Bollinger Bands, with the bands narrowing, indicating decreasing volatility.
- Conclusion: Volatility indicators point towards a consolidation phase with reduced price fluctuations.
Volume Analysis:
- On-Balance Volume (OBV): The OBV has been relatively stable, indicating no significant divergence between volume and price movements.
- Chaikin Money Flow (CMF): The CMF has been consistently at 0, suggesting a lack of significant buying or selling pressure.
- Conclusion: Volume indicators reflect a neutral stance with no clear indication of strong buying or selling pressure.
Overall Conclusion:
Based on the analysis of trend, momentum, volatility, and volume indicators, the stock price of AGIH is likely to experience sideways movement in the near future. The trend indicators suggest an upward bias, while momentum indicators indicate a potential reversal or sideways movement. Volatility is decreasing, pointing towards a consolidation phase, and volume indicators show a lack of significant buying or selling pressure.
Recommendation:
Considering the mixed signals from the technical indicators, it is advisable for investors to exercise caution and closely monitor the stock price of AGIH in the coming days. Traders may consider implementing range-bound strategies to capitalize on potential sideways movements, while long-term investors may wait for more clarity in the market dynamics before making significant decisions.
Disclaimer:
It is important to note that technical analysis is not a guaranteed predictor of future price movements, and external factors can influence stock prices. Investors should conduct thorough research and consider multiple indicators before making investment decisions. Consulting with a financial advisor is recommended for personalized guidance tailored to individual investment goals and risk tolerance levels.