Technical Analysis of AGQI 2024-05-10
Overview:
In analyzing the technical indicators for AGQI over the last 5 days, we will delve into the trends, momentum, volatility, and volume indicators to provide a comprehensive outlook on the possible stock price movement in the coming days. By examining these key aspects, we aim to offer valuable insights and predictions to guide your investment decisions.
Trend Indicators:
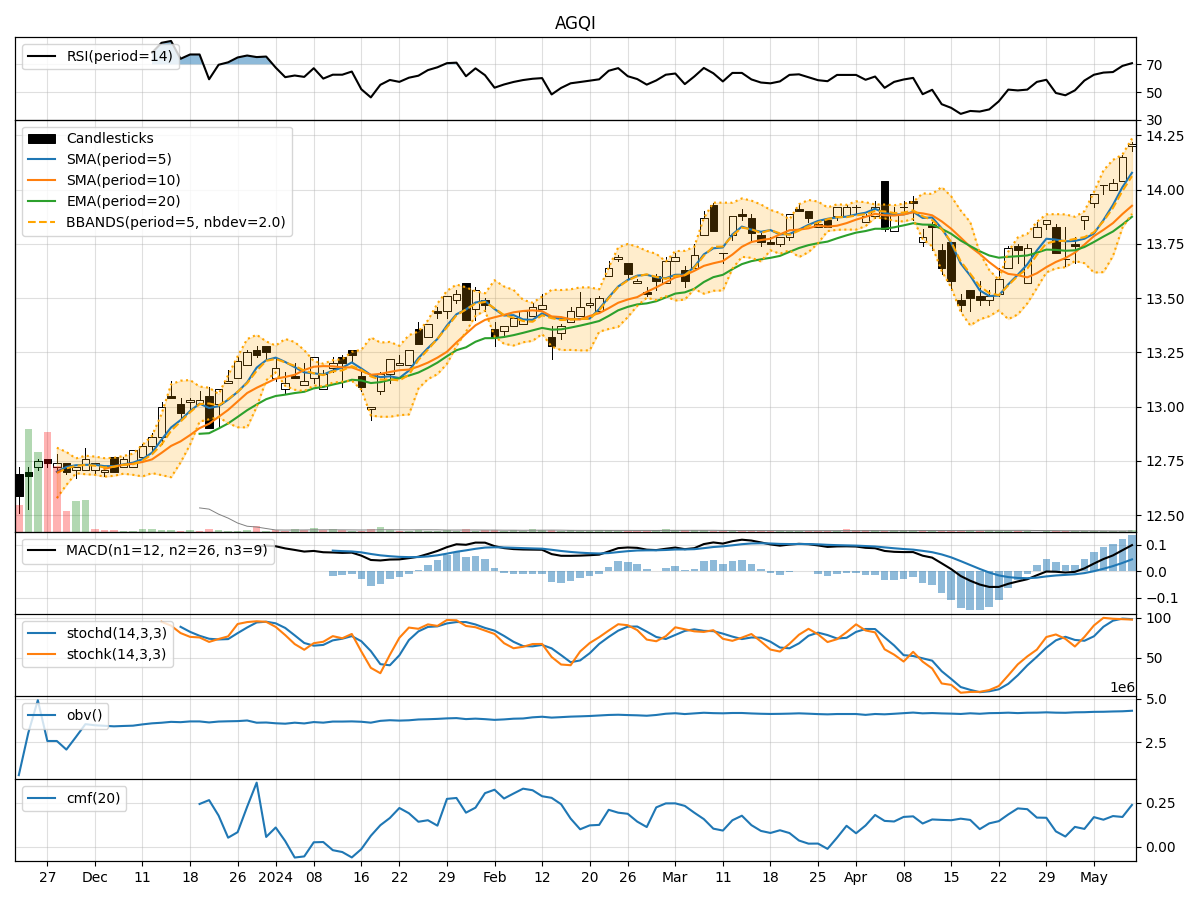
- Moving Averages (MA): The 5-day moving average has been consistently above the short-term (10-day) simple moving average, indicating a bullish trend.
- Exponential Moving Average (EMA): The EMA has been steadily increasing, reflecting positive price momentum.
- Moving Average Convergence Divergence (MACD): The MACD and signal line have shown a positive crossover, suggesting bullish momentum.
Key Observation: The trend indicators point towards an upward trend in the stock price.
Momentum Indicators:
- Relative Strength Index (RSI): RSI has been trending upwards, indicating increasing buying pressure.
- Stochastic Oscillator: Both %K and %D have been consistently high, signaling strong bullish momentum.
- Williams %R (Willams %R): The indicator has been hovering in the oversold territory, suggesting a potential reversal.
Key Observation: Momentum indicators suggest a bullish sentiment in the market.
Volatility Indicators:
- Bollinger Bands (BB): The stock price has been trading within the bands, indicating stable volatility.
Key Observation: Volatility remains stable with no significant spikes.
Volume Indicators:
- On-Balance Volume (OBV): The OBV has been steadily increasing, reflecting accumulation by investors.
- Chaikin Money Flow (CMF): The CMF has been positive, indicating buying pressure in the stock.
Key Observation: Volume indicators suggest positive investor sentiment and accumulation.
Conclusion:
Based on the analysis of the technical indicators, the overall outlook for AGQI in the next few days appears bullish. The trend indicators, momentum indicators, and volume indicators all point towards a continuation of the upward trend in the stock price. The stable volatility further supports the bullish sentiment in the market.
Recommendation: Considering the positive technical signals, it may be a favorable time to consider a long position in AGQI. However, it is essential to monitor the indicators closely for any signs of reversal or divergence from the current trend.