Technical Analysis of AGRH 2024-05-10
Overview:
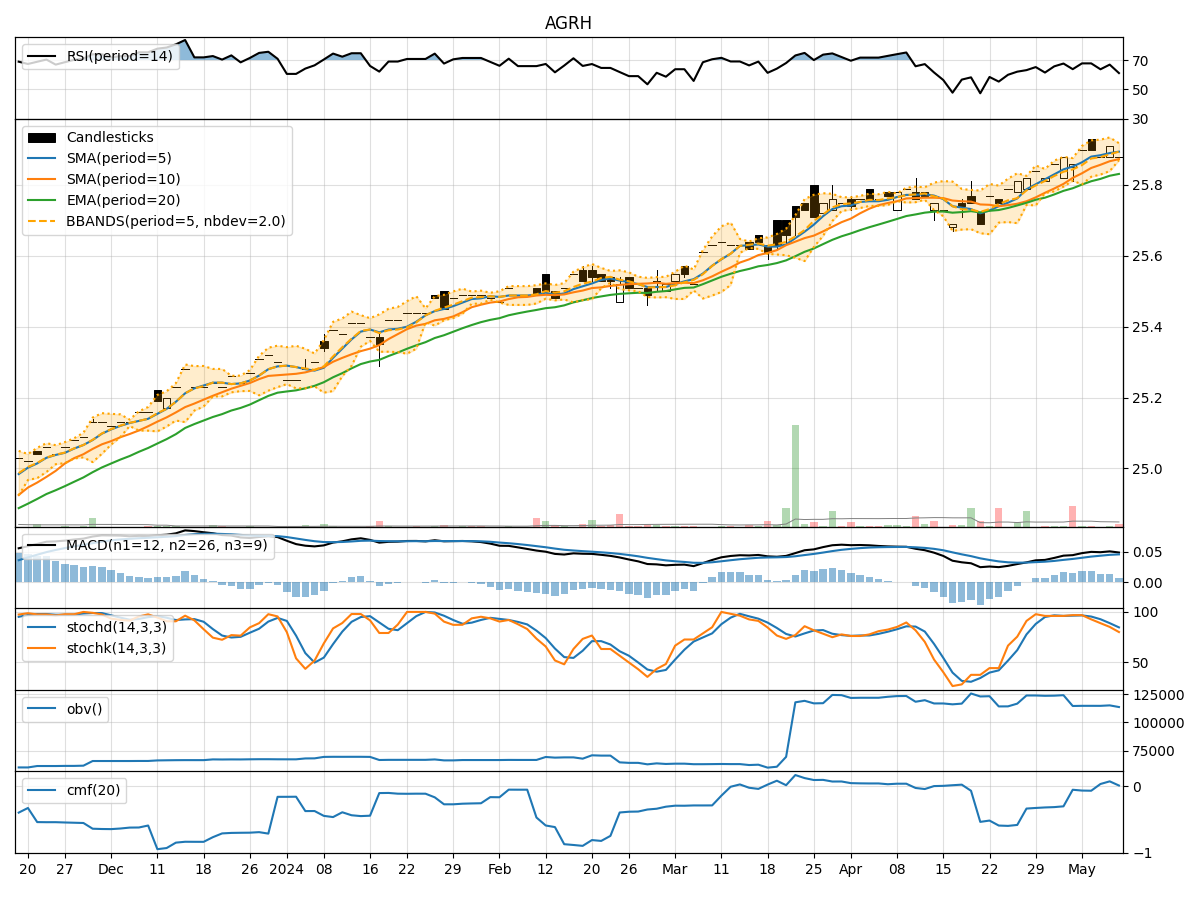
In analyzing the technical indicators for AGRH over the last 5 days, we will delve into the trend, momentum, volatility, and volume indicators to provide a comprehensive outlook on the possible stock price movement in the coming days. By examining these key aspects, we aim to offer valuable insights and predictions to guide your investment decisions.
Trend Analysis:
- Moving Averages (MA): The 5-day MA has been relatively stable around the current stock price, indicating a neutral trend.
- MACD: The MACD line has shown slight fluctuations but remains close to the signal line, suggesting a lack of strong momentum in either direction.
- EMA: The EMA has been gradually increasing, reflecting a mild bullish sentiment in the short term.
Momentum Analysis:
- RSI: The RSI has been fluctuating around the neutral level of 50, indicating a balanced momentum between buying and selling pressure.
- Stochastic Oscillator: Both %K and %D have been declining, signaling a potential bearish momentum in the near future.
- Williams %R: The indicator has been in the oversold territory, suggesting a possible reversal to the upside.
Volatility Analysis:
- Bollinger Bands: The bands have been relatively narrow, indicating low volatility and a period of consolidation.
- Bollinger %B: The %B indicator has been hovering around the middle range, further confirming the consolidation phase.
- Average True Range (ATR): The ATR has shown a decrease in volatility, supporting the consolidation pattern.
Volume Analysis:
- On-Balance Volume (OBV): The OBV has been fluctuating, reflecting indecision among market participants.
- Chaikin Money Flow (CMF): The CMF has been oscillating around the zero line, indicating a balance between buying and selling pressure.
Conclusion:
Based on the analysis of the technical indicators, the stock of AGRH is likely to experience sideways movement in the next few days. The lack of strong trends in the moving averages, mixed signals from momentum indicators, low volatility, and indecisive volume patterns suggest a period of consolidation. Traders may expect the stock price to trade within a narrow range without a clear directional bias. It is advisable to closely monitor key support and resistance levels for potential breakout opportunities.
In summary, the overall outlook for AGRH is neutral with a bias towards consolidation. Investors should exercise caution and wait for clearer signals before making significant trading decisions.