Technical Analysis of AGZ 2024-05-10
Overview:
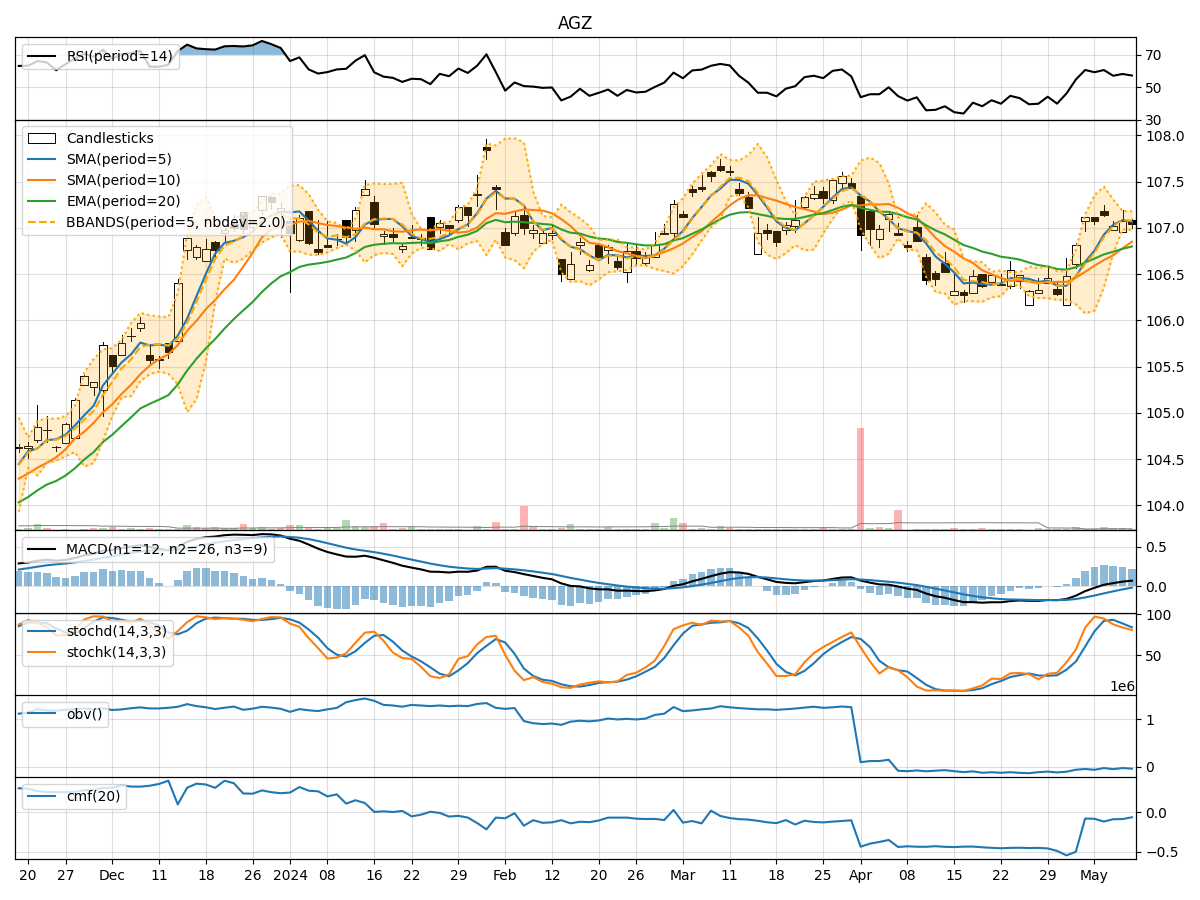
In analyzing the technical indicators for AGZ over the last 5 days, we will delve into the trend, momentum, volatility, and volume indicators to provide a comprehensive outlook on the possible stock price movement in the coming days.
Trend Indicators:
- Moving Averages (MA): The 5-day Moving Average (MA) has been consistently above the Simple Moving Average (SMA) and Exponential Moving Average (EMA), indicating a bullish trend.
- MACD: The MACD line has been consistently above the signal line, with both lines showing an upward trend, suggesting bullish momentum.
- MACD Histogram: The MACD Histogram has been consistently above the zero line, indicating increasing bullish momentum.
Momentum Indicators:
- RSI: The Relative Strength Index (RSI) has been fluctuating around the 50 level, indicating a neutral momentum.
- Stochastic Oscillator: Both %K and %D lines of the Stochastic Oscillator have been trending downwards, suggesting a potential bearish momentum.
- Williams %R: The Williams %R is in the oversold territory, indicating a potential reversal in momentum.
Volatility Indicators:
- Bollinger Bands: The stock price has been trading within the Bollinger Bands, with the bands narrowing, suggesting a period of consolidation.
- Bollinger %B: The %B indicator is below 1, indicating the price is below the upper band, potentially signaling a short-term pullback.
Volume Indicators:
- On-Balance Volume (OBV): The OBV has been declining, indicating selling pressure in the stock.
- Chaikin Money Flow (CMF): The CMF has been negative, suggesting outflow of money from the stock.
Key Observations and Opinions:
- Trend: The trend indicators suggest a bullish sentiment in the short term.
- Momentum: The momentum indicators are mixed, with RSI neutral, Stochastic showing bearish signals, and Williams %R indicating oversold conditions.
- Volatility: Volatility is decreasing, indicating a period of consolidation.
- Volume: The declining OBV and negative CMF suggest a bearish sentiment in terms of volume flow.
Conclusion:
Based on the analysis of the technical indicators, the next few days for AGZ could see sideways movement with a slight bearish bias. Traders should exercise caution and closely monitor key support and resistance levels for potential entry or exit points. It is advisable to wait for further confirmation from the indicators before making significant trading decisions.