Technical Analysis of AHOY 2024-05-10
Overview:
In analyzing the technical indicators for AHOY stock over the last 5 days, we will delve into the trend, momentum, volatility, and volume indicators to provide a comprehensive outlook on the possible future stock price movement. By examining these key indicators, we aim to offer valuable insights and predictions for the upcoming trading days.
Trend Indicators:
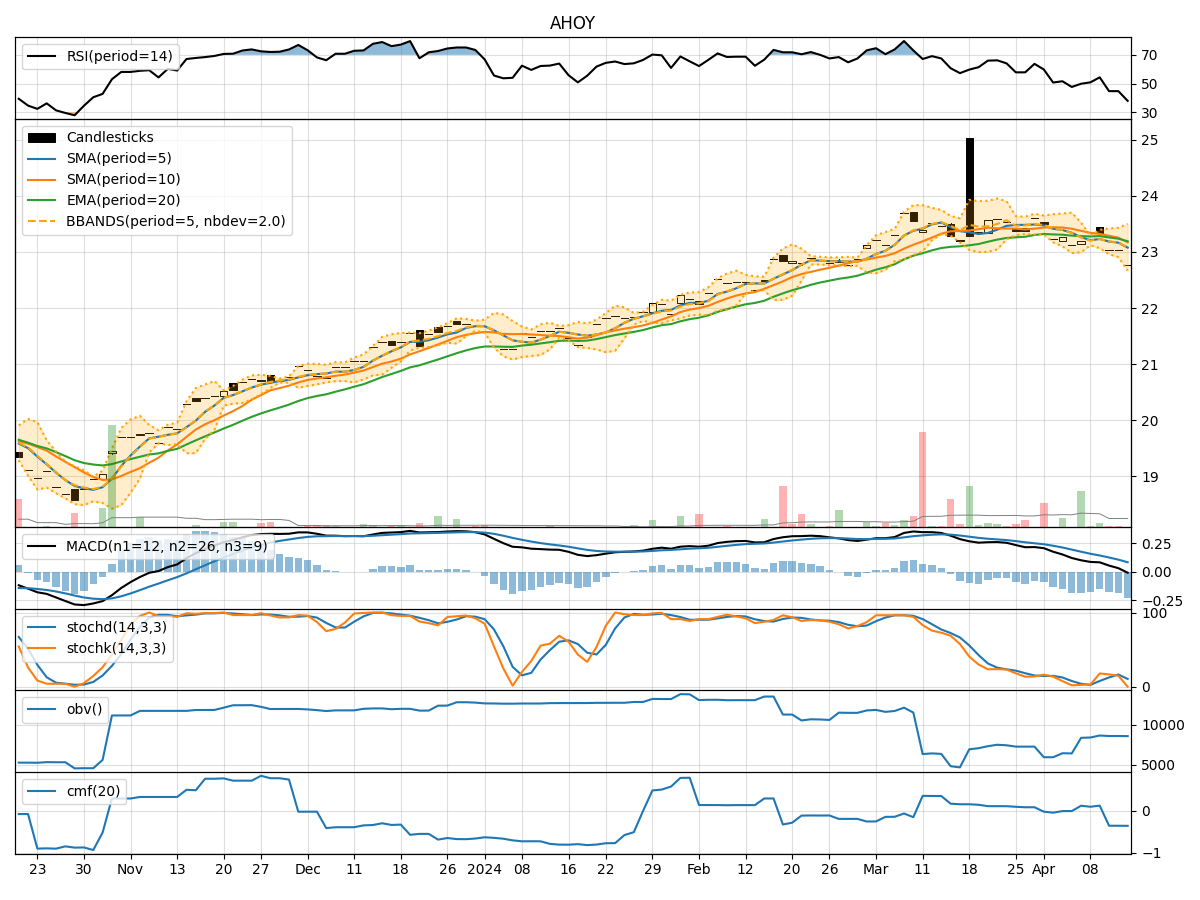
- Moving Averages (MA): The 5-day Moving Average (MA) has been consistently trending upwards, indicating a bullish momentum in the short term.
- MACD (Moving Average Convergence Divergence): The MACD line has been above the signal line, suggesting a positive trend in price momentum.
- RSI (Relative Strength Index): The RSI values have been in the overbought territory, indicating a strong bullish sentiment in the market.
Momentum Indicators:
- Stochastic Oscillator: The Stochastic Oscillator has been in the overbought region, signaling a potential reversal or consolidation in the near future.
- Williams %R (Willams Percentage Range): The Williams %R has been hovering near the oversold levels, suggesting a possible reversal in the stock price.
Volatility Indicators:
- Bollinger Bands (BB): The Bollinger Bands have shown an expansion in volatility, indicating potential price swings in the upcoming trading sessions.
- Average True Range (ATR): The ATR values have increased, suggesting higher volatility in the stock.
Volume Indicators:
- On-Balance Volume (OBV): The OBV has been declining, indicating a potential distribution phase where selling pressure might be increasing.
- Chaikin Money Flow (CMF): The CMF has been positive, suggesting that money flow into the stock has been relatively strong.
Key Observations:
- The stock has exhibited strong bullish momentum based on the moving averages, MACD, and RSI indicators.
- However, the overbought conditions in the Stochastic Oscillator and potential reversal signals in the Williams %R indicate a possible correction or consolidation.
- The expanding Bollinger Bands and increased ATR point towards heightened volatility in the stock price.
- The declining OBV raises concerns about the sustainability of the bullish trend, while the positive CMF indicates ongoing buying interest.
Conclusion:
Based on the analysis of the technical indicators, the stock is likely to experience a short-term correction or consolidation due to the overbought conditions and potential reversal signals in the momentum indicators. The increased volatility suggests that price swings are expected in the upcoming trading days. Investors should exercise caution and consider taking profits or implementing risk management strategies to navigate the potential market fluctuations.