Technical Analysis of AIEQ 2024-05-10
Overview:
In the last 5 trading days, AIEQ stock has shown mixed signals across various technical indicators. The stock price has been fluctuating within a narrow range, with some indicators suggesting potential bullish momentum while others indicating a possible consolidation phase. Let's delve deeper into each category of technical indicators to provide a comprehensive analysis and make a prediction for the next few days.
Trend Indicators:
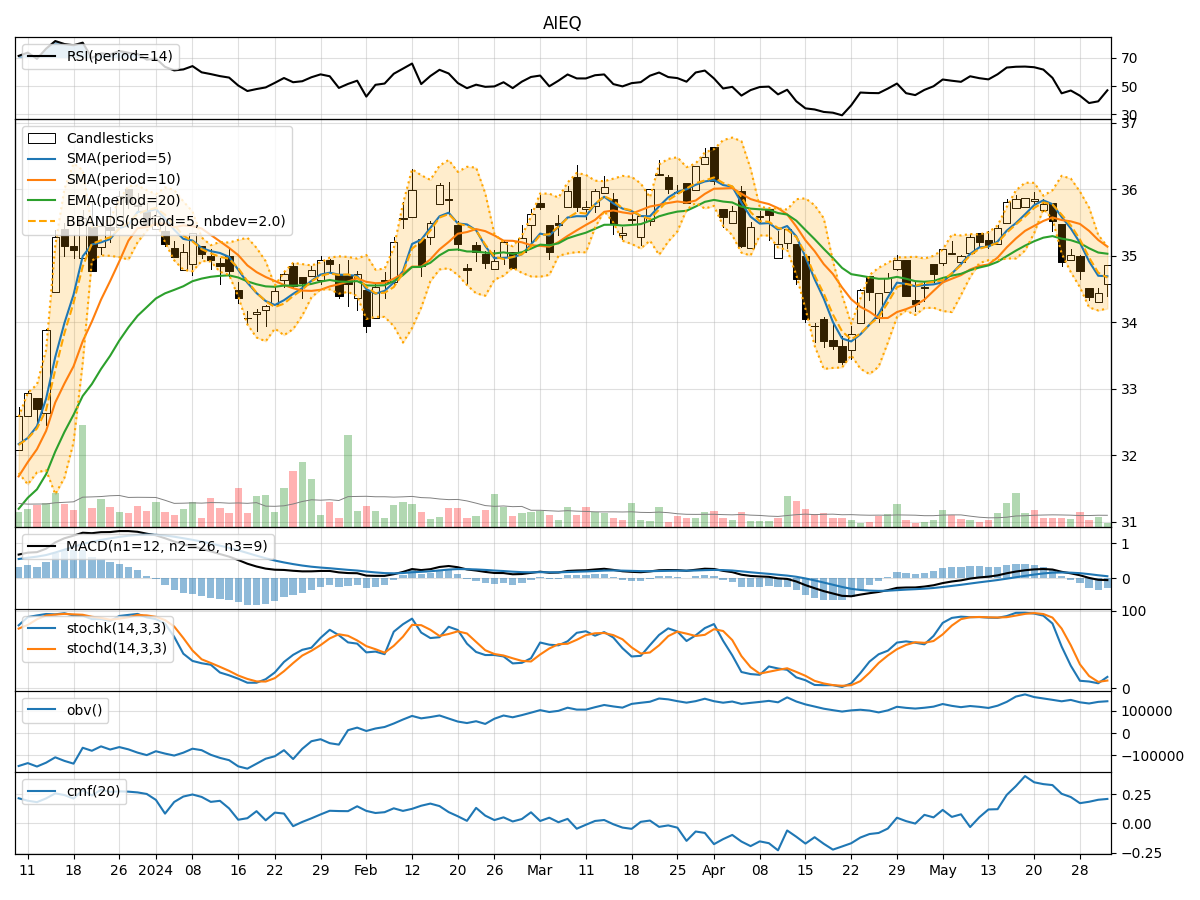
- Moving Averages (MA): The 5-day Moving Average (MA) has been trending slightly above the Simple Moving Average (SMA) and Exponential Moving Average (EMA), indicating a short-term bullish trend.
- MACD: The MACD line has been consistently below the signal line, suggesting a bearish momentum in the stock price.
- MACD Histogram: The MACD Histogram has been decreasing but still above the zero line, indicating a weakening bearish momentum.
Momentum Indicators:
- RSI: The Relative Strength Index (RSI) has been fluctuating around the 50 level, indicating a neutral momentum in the stock.
- Stochastic Oscillator: Both %K and %D lines of the Stochastic Oscillator have been in the overbought zone, suggesting a potential reversal in the stock price.
- Williams %R: The Williams %R indicator has been fluctuating in the oversold territory, indicating a potential buying opportunity.
Volatility Indicators:
- Bollinger Bands (BB): The Bollinger Bands have been narrowing, indicating decreasing volatility in the stock price.
- Bollinger %B: The %B indicator has been hovering around 0.5, suggesting a neutral stance in terms of volatility.
Volume Indicators:
- On-Balance Volume (OBV): The OBV indicator has been relatively flat, indicating a balance between buying and selling pressure.
- Chaikin Money Flow (CMF): The CMF has been fluctuating around the zero line, suggesting a neutral money flow in the stock.
Key Observations and Opinions:
- Trend: The stock is currently in a short-term bullish trend based on moving averages, but the MACD signals a bearish momentum.
- Momentum: Momentum indicators are mixed, with RSI indicating neutrality, Stochastic Oscillator signaling a potential reversal, and Williams %R showing a buying opportunity.
- Volatility: Volatility has been decreasing, as indicated by the narrowing Bollinger Bands.
- Volume: Volume indicators suggest a balance between buying and selling pressure, with no clear direction.
Conclusion:
Based on the analysis of technical indicators, the next few days for AIEQ stock could see sideways movement with a slight bullish bias. Traders should closely monitor the Stochastic Oscillator for a potential reversal signal and keep an eye on the MACD for any changes in momentum. It is advisable to wait for clearer signals before making significant trading decisions.