Technical Analysis of AIQ 2024-05-10
Overview:
In analyzing the provided technical indicators for the last 5 days, we will delve into the trend, momentum, volatility, and volume indicators to forecast the possible stock price movement for the next few days. By examining these key aspects, we aim to provide a comprehensive and insightful prediction backed by data-driven analysis.
Trend Indicators:
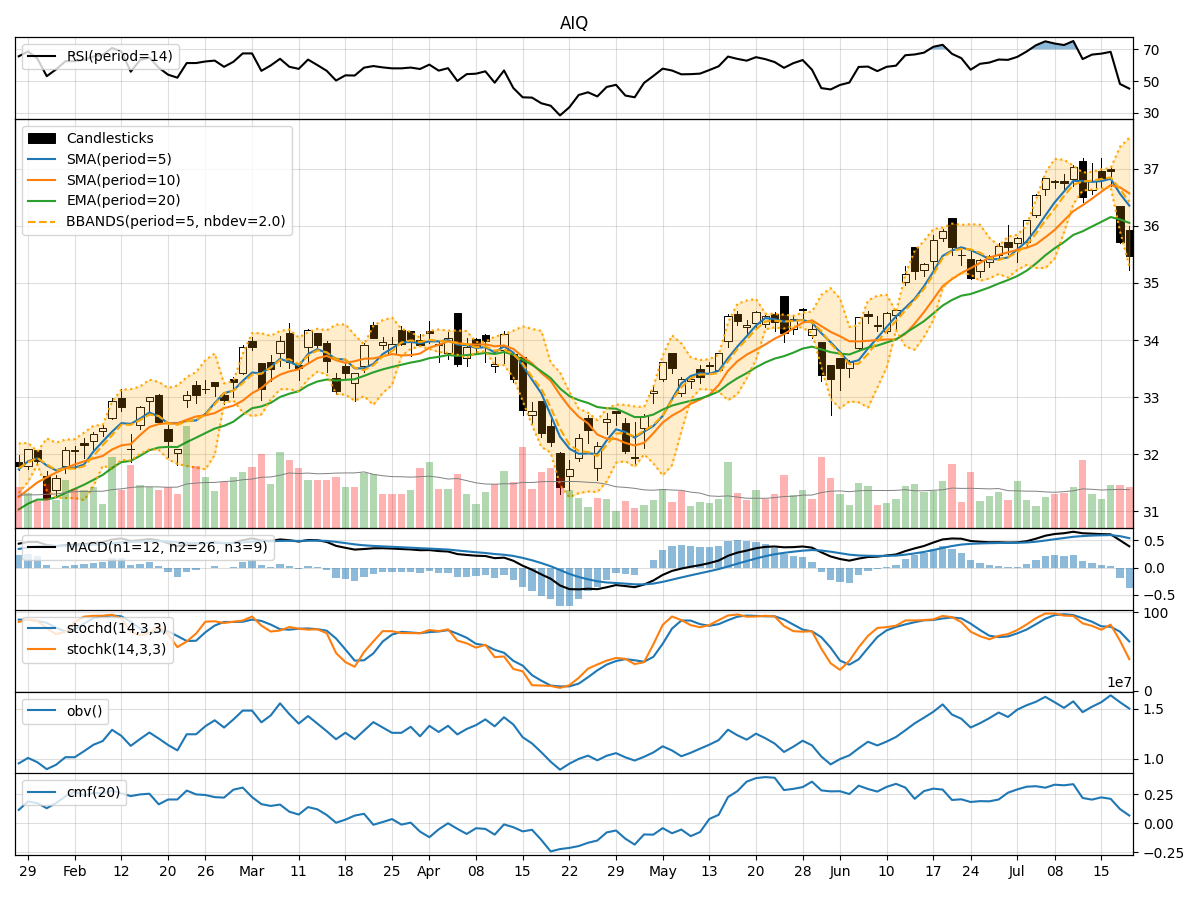
- Moving Averages (MA): The moving averages show a consistent uptrend with the closing price above the short-term moving averages, indicating a positive trend.
- MACD: The MACD line has been consistently above the signal line, suggesting bullish momentum.
- EMA: The exponential moving average has been trending upwards, supporting the bullish sentiment.
Momentum Indicators:
- RSI: The Relative Strength Index has been fluctuating around the neutral zone, indicating a balanced momentum.
- Stochastic Oscillator: The stochastic indicators have been in the overbought region, suggesting a potential reversal or consolidation.
- Williams %R: The Williams %R is in the oversold territory, signaling a possible buying opportunity.
Volatility Indicators:
- Bollinger Bands: The Bollinger Bands have been narrowing, indicating decreasing volatility and a potential breakout in the near future.
- Bollinger %B: The %B indicator is hovering around the middle range, suggesting a period of consolidation.
Volume Indicators:
- On-Balance Volume (OBV): The OBV has been declining, indicating selling pressure in the market.
- Chaikin Money Flow (CMF): The CMF has been negative, reflecting a lack of buying interest.
Key Observations:
- The trend indicators suggest a bullish sentiment with the moving averages and MACD supporting an upward trajectory.
- Momentum indicators show mixed signals with RSI in a neutral zone, stochastic indicators at extreme levels, and Williams %R signaling a potential reversal.
- Volatility indicators point towards decreasing volatility and a possible breakout in the near future.
- Volume indicators indicate selling pressure and a lack of significant buying interest in the market.
Conclusion:
Based on the analysis of the technical indicators, the stock is likely to experience sideways consolidation in the next few days. The mixed signals from momentum indicators, coupled with decreasing volatility and selling pressure reflected in volume indicators, suggest a period of indecision in the market. Traders should exercise caution and wait for clearer signals before taking any significant positions.