Technical Analysis of AIRR 2024-05-10
Overview:
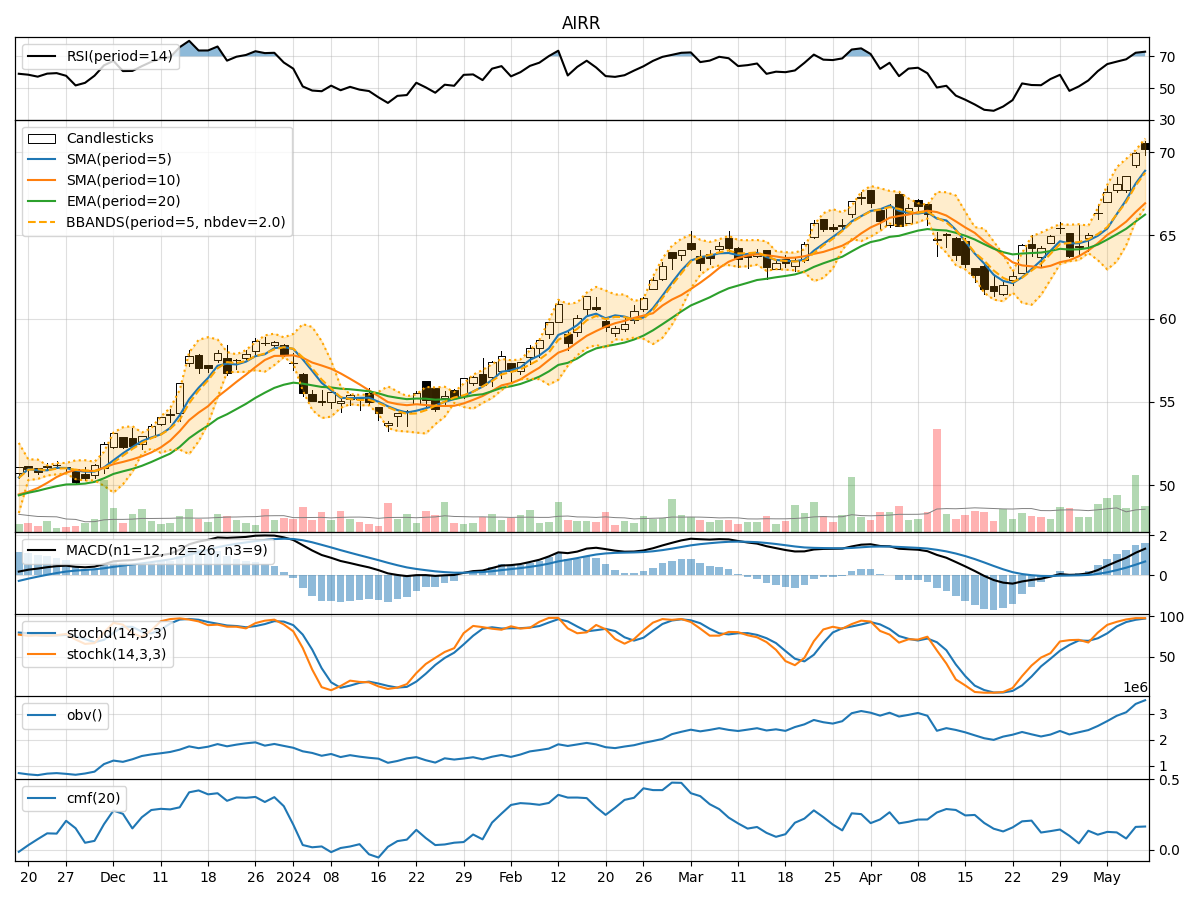
In analyzing the technical indicators for AIRR stock over the last 5 days, we will delve into the trends, momentum, volatility, and volume indicators to provide a comprehensive outlook on the possible future stock price movement. By examining key metrics such as moving averages, MACD, RSI, Bollinger Bands, and volume trends, we aim to offer valuable insights and predictions for the upcoming trading days.
Trend Analysis:
- Moving Averages (MA): The 5-day moving average has been consistently trending upwards, indicating a bullish momentum in the short term.
- MACD: The MACD line has been above the signal line for the past 5 days, suggesting a bullish trend.
- EMA: The exponential moving average has also been on an upward trajectory, supporting the bullish sentiment.
Momentum Analysis:
- RSI: The Relative Strength Index has been increasing and is currently in the overbought territory, signaling a strong bullish momentum.
- Stochastic Oscillator: Both %K and %D lines are in the overbought zone, indicating a potential reversal or consolidation in the near future.
- Williams %R: The Williams %R is in the oversold region, suggesting a possible pullback or correction.
Volatility Analysis:
- Bollinger Bands: The stock price has been consistently trading above the middle Bollinger Band, indicating an uptrend with low volatility.
- Bollinger Band Width: The band width has been narrowing, suggesting a potential decrease in volatility and a period of consolidation.
Volume Analysis:
- On-Balance Volume (OBV): The OBV has been steadily increasing, reflecting strong buying pressure and accumulation of the stock.
- Chaikin Money Flow (CMF): The CMF is positive, indicating that money is flowing into the stock, supporting the bullish bias.
Key Observations:
- The technical indicators collectively suggest a strong bullish sentiment in the short term, supported by the uptrend in moving averages, MACD, RSI, and OBV.
- However, the overbought conditions in RSI and Stochastic Oscillator signal a potential reversal or consolidation in the near future.
- The narrowing Bollinger Bands and positive CMF indicate a period of consolidation with reduced volatility.
Conclusion:
Based on the analysis of the technical indicators, the next few days for AIRR stock are likely to see a consolidation phase with a potential for a short-term pullback due to overbought conditions. Traders should exercise caution and consider taking profits or implementing risk management strategies. The overall trend remains bullish, but a period of sideways movement or correction may be on the horizon.