Technical Analysis of AIVI 2024-05-10
Overview:
In analyzing the technical indicators for AIVI stock over the last 5 days, we will delve into the trends, momentum, volatility, and volume indicators to provide a comprehensive outlook on the possible future stock price movement. By examining these key indicators, we aim to offer valuable insights and predictions for the upcoming trading days.
Trend Analysis:
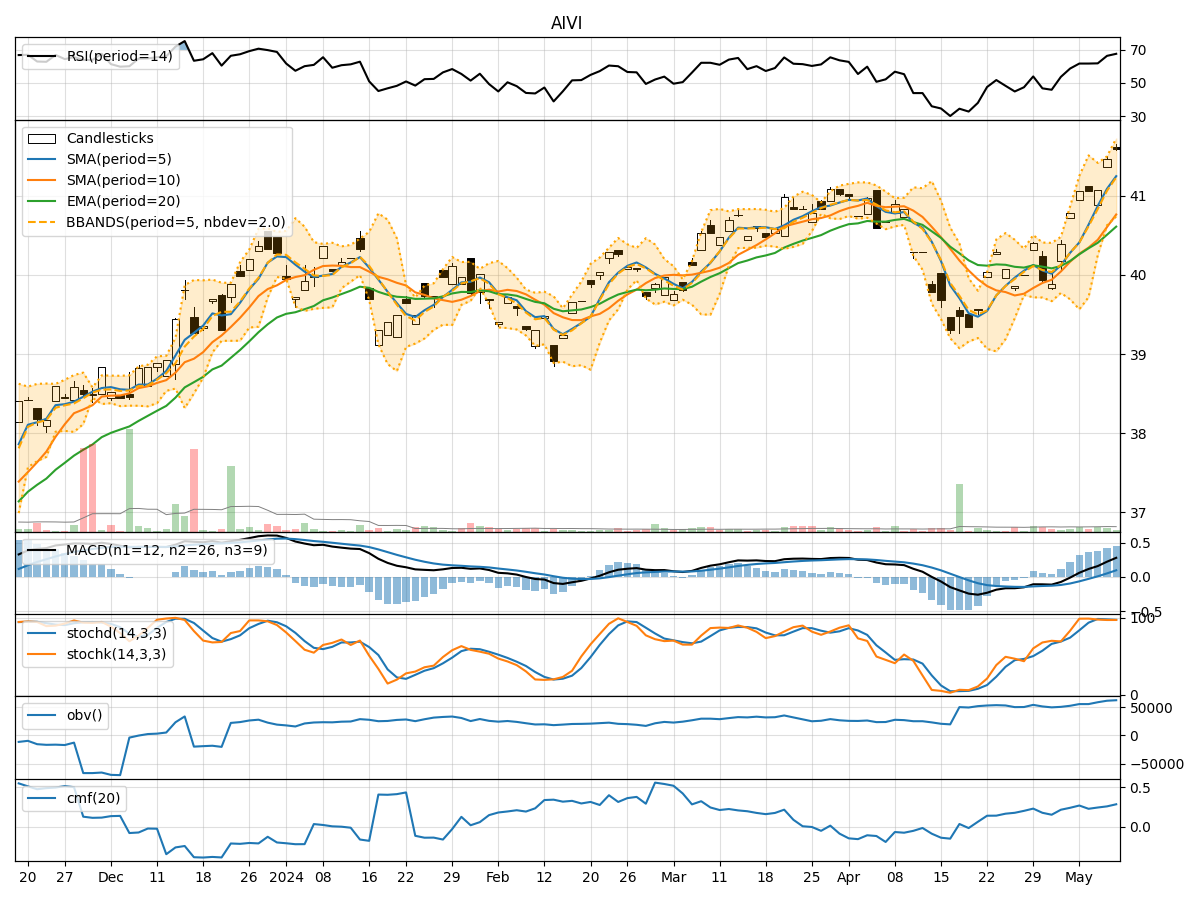
- Moving Averages (MA): The 5-day Moving Average (MA) has been consistently trending above the Simple Moving Average (SMA) and Exponential Moving Average (EMA) over the past 5 days, indicating a bullish trend.
- MACD: The Moving Average Convergence Divergence (MACD) has shown positive values, with the MACD line consistently above the Signal line, suggesting bullish momentum in the stock price.
Momentum Analysis:
- RSI: The Relative Strength Index (RSI) has been hovering in the range of 60-70, indicating a neutral to slightly bullish momentum.
- Stochastic Oscillator: Both %K and %D lines of the Stochastic Oscillator have been in the overbought zone, suggesting a potential reversal in the short term.
Volatility Analysis:
- Bollinger Bands (BB): The stock price has been trading within the Bollinger Bands, with the bands narrowing, indicating decreasing volatility and a possible consolidation phase.
Volume Analysis:
- On-Balance Volume (OBV): The OBV indicator has shown a slight increase over the last 5 days, suggesting accumulation by investors.
- Chaikin Money Flow (CMF): The CMF has been positive, indicating buying pressure in the stock.
Conclusion:
Based on the analysis of the technical indicators, the stock of AIVI is likely to experience a sideways movement in the upcoming trading days. The trend indicators suggest a bullish sentiment, supported by the positive MACD values. However, the overbought levels in the Stochastic Oscillator signal a potential short-term reversal. The volatility indicators point towards a consolidation phase, while the volume indicators indicate accumulation and buying pressure.
Recommendation:
Considering the overall analysis, it is advisable to exercise caution in trading AIVI stock in the short term. Investors may consider waiting for a clearer signal from the Stochastic Oscillator before making any significant trading decisions. Long-term investors can continue to hold their positions, considering the positive trend and buying pressure indicated by the technical indicators.
Disclaimer:
This analysis is based solely on technical indicators and historical data, and it is essential to consider other fundamental factors and market dynamics before making any investment decisions. It is recommended to consult with a financial advisor or conduct further research before acting on the insights provided.