Technical Analysis of AJAN 2024-05-10
Overview:
In analyzing the technical indicators for AJAN stock over the last 5 days, we will delve into the trends, momentum, volatility, and volume aspects to provide a comprehensive outlook on the possible stock price movement in the coming days. By examining key indicators such as moving averages, MACD, RSI, Bollinger Bands, and OBV, we aim to offer valuable insights and predictions for informed decision-making.
Trend Analysis:
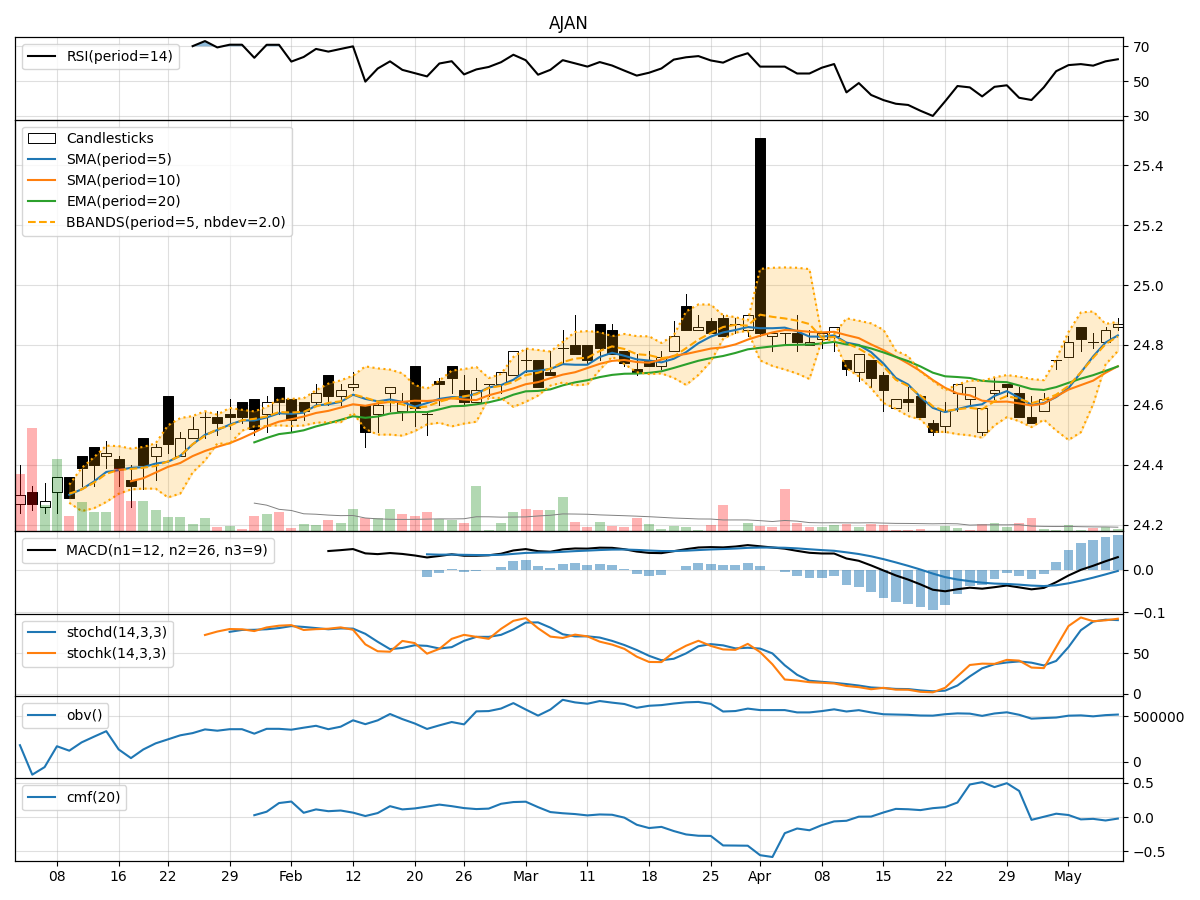
- Moving Averages (MA): The 5-day moving average has been consistently above the closing prices, indicating a short-term uptrend.
- MACD: The MACD line has been trending upwards, with the MACD histogram showing an increasing positive momentum.
- EMA: The exponential moving average has been steadily rising, supporting the bullish trend.
Key Observation: The trend indicators suggest a bullish sentiment in the short term.
Momentum Analysis:
- RSI: The Relative Strength Index has been increasing, indicating strengthening buying momentum.
- Stochastic Oscillator: Both %K and %D lines are in the overbought zone, suggesting a potential reversal or consolidation.
- Williams %R: The indicator is in the oversold territory, signaling a possible buying opportunity.
Key Observation: Momentum indicators show a mixed signal, with RSI indicating bullish momentum but Stochastic and Williams %R suggesting caution.
Volatility Analysis:
- Bollinger Bands: The stock price has been trading within the bands, with the bands narrowing, indicating decreasing volatility.
- Bollinger %B: The %B indicator is hovering around 0.8, suggesting the stock is trading near the upper band.
Key Observation: Volatility indicators point towards a consolidation phase with decreasing volatility.
Volume Analysis:
- On-Balance Volume (OBV): The OBV has been fluctuating but overall showing a slight decrease, indicating some distribution.
- Chaikin Money Flow (CMF): The CMF is negative, suggesting selling pressure in the stock.
Key Observation: Volume indicators reflect a bearish sentiment with some selling pressure.
Conclusion:
Based on the analysis of trend, momentum, volatility, and volume indicators, the next few days' possible stock price movement for AJAN is likely to be sideways to slightly bearish. While the trend indicators signal a bullish sentiment, the mixed momentum signals, decreasing volatility, and bearish volume indicators suggest a potential consolidation or minor pullback in the stock price.
Recommendation: Traders should exercise caution and consider waiting for more clarity in price action before making significant trading decisions. Keep a close watch on key support and resistance levels for potential entry or exit points.
Remember, market dynamics can change rapidly, so it's essential to monitor the stock closely and adjust your strategy accordingly.