Technical Analysis of ALUM 2024-05-10
Overview:
In analyzing the technical indicators for ALUM stock over the last 5 days, we will delve into the trend, momentum, volatility, and volume indicators to provide a comprehensive outlook on the possible stock price movement in the coming days. By examining these key indicators, we aim to offer valuable insights and predictions for potential investors.
Trend Analysis:
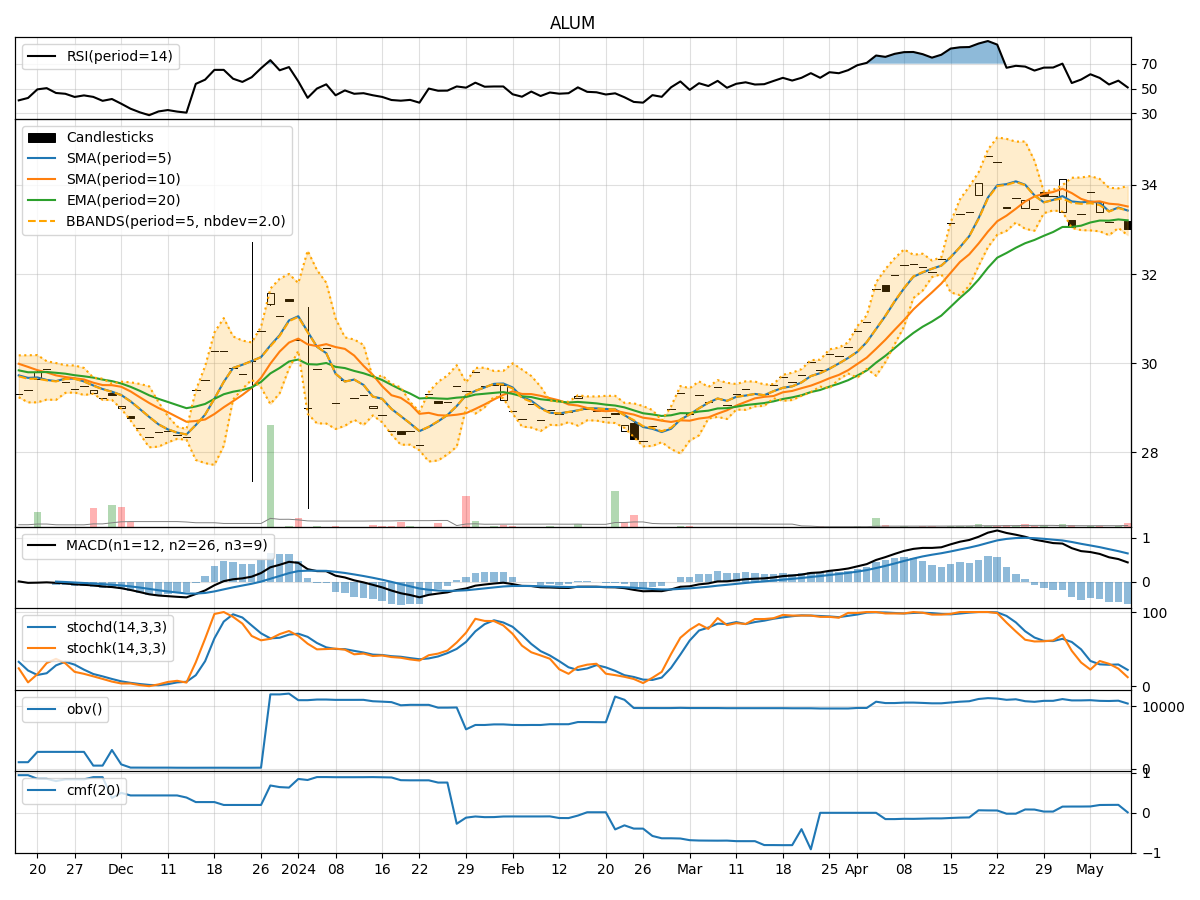
- Moving Averages (MA): The 5-day Moving Average (MA) has been fluctuating around the current stock price, indicating a lack of clear trend direction.
- MACD: The Moving Average Convergence Divergence (MACD) has been positive but decreasing, suggesting a potential slowdown in bullish momentum.
- RSI: The Relative Strength Index (RSI) has been hovering around the neutral zone, indicating a balanced market sentiment.
Momentum Analysis:
- Stochastic Oscillator: The Stochastic Oscillator shows a downward trend, indicating a potential bearish momentum.
- Williams %R: The Williams %R indicator is in oversold territory, suggesting a possible reversal in the short term.
Volatility Analysis:
- Bollinger Bands: The Bollinger Bands are narrowing, indicating decreasing volatility and a potential upcoming price breakout.
- Average True Range (ATR): The ATR has been relatively stable, suggesting consistent price movements.
Volume Analysis:
- On-Balance Volume (OBV): The OBV has been fluctuating, indicating mixed buying and selling pressure.
- Chaikin Money Flow (CMF): The CMF is positive but decreasing, signaling a potential decrease in buying pressure.
Key Observations:
- The trend indicators show a lack of clear direction, with mixed signals from the moving averages and MACD.
- Momentum indicators suggest a potential shift towards bearish sentiment, as seen in the Stochastic Oscillator and Williams %R.
- Volatility indicators point towards a potential breakout as the Bollinger Bands narrow.
- Volume indicators reflect mixed buying and selling pressure, with a slight decrease in buying pressure indicated by the CMF.
Conclusion:
Based on the analysis of the technical indicators, the stock price of ALUM is likely to experience a downward movement in the coming days. The bearish momentum indicated by the Stochastic Oscillator and Williams %R, coupled with the lack of clear trend direction from the moving averages and decreasing buying pressure from the CMF, suggest a potential decline in stock price. Traders and investors should exercise caution and consider short-term selling strategies to capitalize on the anticipated downward movement.