Technical Analysis of AMDS 2024-05-10
Overview:
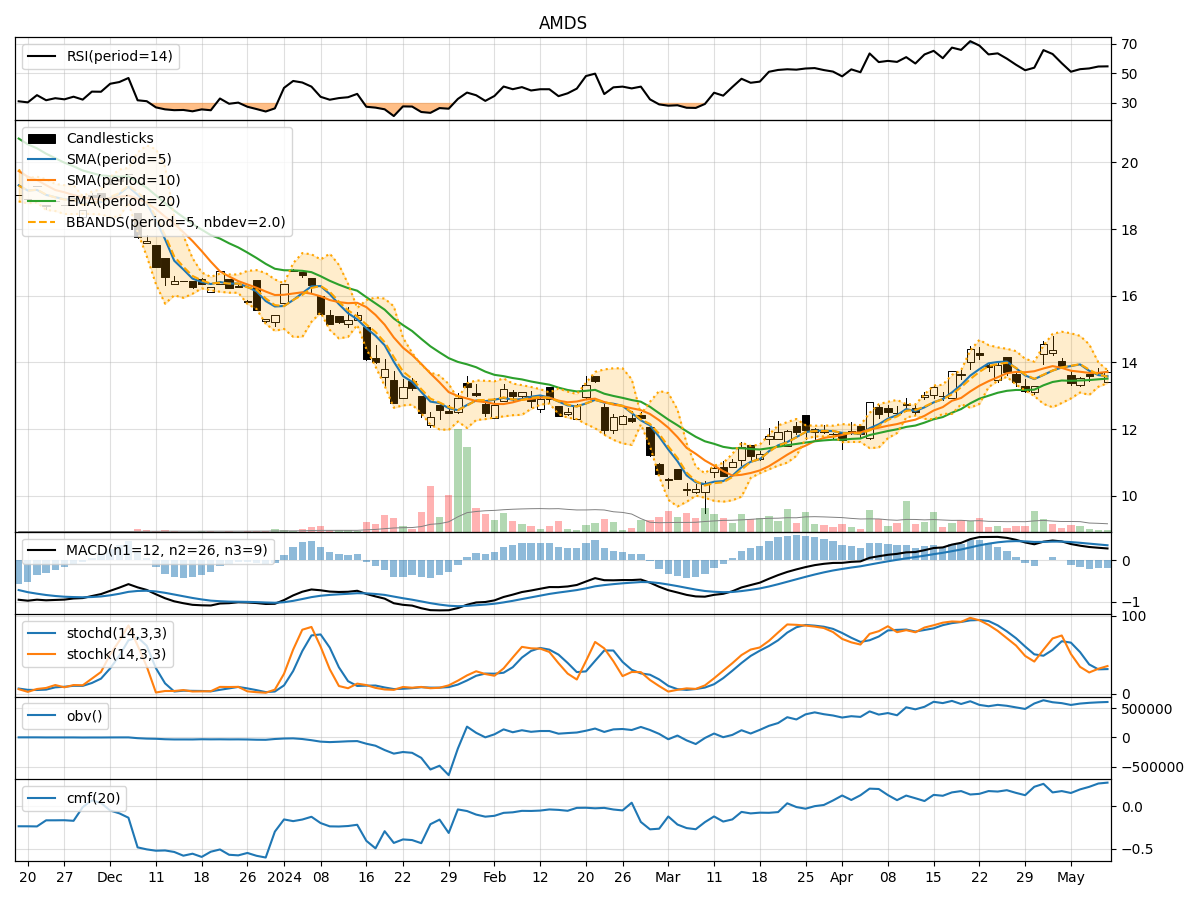
In analyzing the technical indicators for AMDS over the last 5 days, we will delve into the trend, momentum, volatility, and volume indicators to provide a comprehensive outlook on the possible stock price movement. By examining these key aspects, we aim to offer valuable insights and predictions for the upcoming days.
Trend Analysis:
- Moving Averages (MA): The 5-day Moving Average (MA) has been consistently below the closing price, indicating a short-term bearish trend.
- MACD: The Moving Average Convergence Divergence (MACD) has been negative, suggesting a bearish momentum in the stock.
- EMA: The Exponential Moving Average (EMA) has been trending slightly upwards but remains below the closing price, reflecting a potential reversal.
Momentum Analysis:
- RSI: The Relative Strength Index (RSI) has been hovering around the neutral zone, indicating a lack of strong momentum in either direction.
- Stochastic Oscillator: Both %K and %D have been relatively low, suggesting a potential oversold condition in the stock.
- Williams %R: The Williams %R is in the oversold territory, signaling a possible buying opportunity.
Volatility Analysis:
- Bollinger Bands: The Bollinger Bands have been narrowing, indicating decreasing volatility in the stock price.
- Bollinger %B: The %B indicator has been gradually increasing, suggesting a potential price reversal or consolidation.
Volume Analysis:
- On-Balance Volume (OBV): The OBV has been steadily increasing, indicating accumulation by investors.
- Chaikin Money Flow (CMF): The CMF has been positive, reflecting buying pressure in the stock.
Key Observations:
- The stock is currently in a short-term bearish trend based on moving averages and MACD.
- Momentum indicators suggest a lack of strong directional momentum.
- Volatility is decreasing, indicating a potential period of consolidation.
- Volume indicators show accumulation and buying pressure in the stock.
Conclusion:
Based on the analysis of technical indicators, the stock is likely to experience sideways movement or consolidation in the next few days. The lack of strong momentum coupled with decreasing volatility points towards a period of stabilization in the stock price. Investors may consider staying cautious and monitoring for a clear trend reversal before making significant trading decisions.