Technical Analysis of AMDY 2024-05-10
Overview:
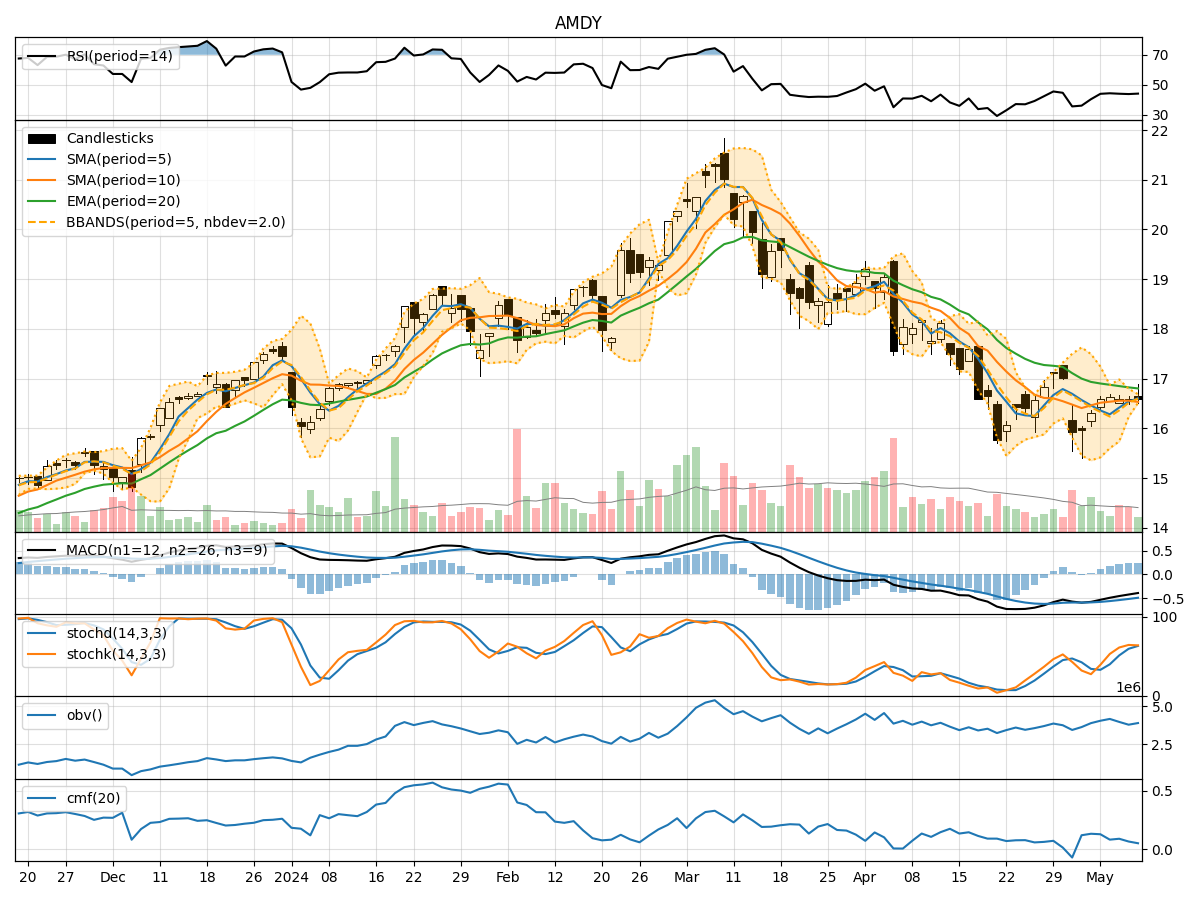
In analyzing the technical indicators for AMDY over the last 5 days, we will delve into the trend, momentum, volatility, and volume indicators to provide a comprehensive outlook on the possible stock price movement in the coming days.
Trend Analysis:
- Moving Averages (MA): The 5-day Moving Average (MA) has been fluctuating around the closing prices, indicating a lack of clear trend direction.
- MACD: The Moving Average Convergence Divergence (MACD) has been negative but showing signs of convergence towards the signal line, suggesting a potential reversal.
- RSI: The Relative Strength Index (RSI) has been hovering around the mid-level, indicating a balanced momentum.
Momentum Analysis:
- Stochastic Oscillator: The Stochastic Oscillator is in the overbought region, suggesting a potential reversal or consolidation.
- Williams %R: The Williams %R is also in the oversold region, indicating a possible buying opportunity.
Volatility Analysis:
- Bollinger Bands: The Bollinger Bands are narrowing, indicating decreasing volatility and a potential breakout or breakdown.
- Average True Range (ATR): The ATR is decreasing, suggesting a decrease in price volatility.
Volume Analysis:
- On-Balance Volume (OBV): The OBV has been fluctuating, indicating indecision among market participants.
- Chaikin Money Flow (CMF): The CMF is positive but decreasing, suggesting a potential outflow of money from the stock.
Key Observations:
- The stock is currently in a consolidation phase with mixed signals from different indicators.
- The lack of a clear trend direction and conflicting signals from momentum indicators indicate uncertainty in the market sentiment.
- Volatility is decreasing, which could precede a period of low price movement.
- Volume indicators show indecision among investors, reflecting a lack of conviction in the stock's direction.
Conclusion:
Based on the analysis of the technical indicators, the stock price of AMDY is likely to consolidate in the coming days. The lack of a clear trend, mixed momentum signals, decreasing volatility, and indecisive volume indicators suggest a period of sideways movement or limited price action. Traders should exercise caution and wait for clearer signals before making significant trading decisions.